A package can be recyclable on paper and still be a bad recycling commodity.
That sounds contradictory only if “recyclable” is treated as one test.
It is not.
A package has to be recognizable by the collection system, survive sorting, enter the right bale, travel to a processor, produce enough usable secondary material and find a buyer willing to pay for that output. A failure at any one of those handoffs can turn a technically recyclable design into material that is routinely discarded.
The useful distinction is:
technical recyclability asks whether the material can be recycled; economic recyclability asks whether the system can afford to keep doing it under real collection, sorting, yield, transport and end-market conditions.
Recycling has a balance sheet at every handoff
The simplest recycling diagram is an arrow:
package → recycling bin → new package.
The commercial version is longer:
collection → sorting → bale → transport → reprocessing → secondary material → end market.
Each step can add cost. Each step can also lose material.
A useful system-level model is:
Net system balance per input tonne = saleable output tonnes × realized output price + external service or policy funding − collection, sorting, transport, reprocessing and residual-disposal costs. All flows must use the same input-tonne and period boundary.
Yield loss reduces saleable output; do not also subtract an invented “yield-loss cost” for the same lost revenue. Actual extra handling or disposal costs may be separate expenses. Payments between actors cancel in a whole-system calculation; external funding and avoided-disposal benefits require explicit boundaries. This is an editorial framework, not an accounting standard. [S1] [S2] [S8]
The important point is that “the polymer can be remelted” or “the fiber can be repulped” describes only one part of the chain.
Collection density decides whether there is enough material to work with
Recycling begins with volume.
A technically recyclable package has little market value if too little of it is captured to justify separate handling.
Collection economics depend on:
- how many households or businesses have access;
- how many participate;
- how much target material is generated in an area;
- how frequently trucks run;
- how far material must travel;
- whether the stream is source-separated or mixed.
The Recycling Partnership’s 2024 U.S. residential study estimated that only 21% of recyclable material was being captured. It attributed most losses to the household stage, before material ever reached a material recovery facility. [S4]
That finding is important because no amount of sophisticated reprocessing technology can recycle a package that never enters the recovery system.
At the MRF, shape can matter as much as resin
Once a package reaches a material recovery facility, the next question is whether machinery can identify and separate it.
For plastics, sortation is affected by much more than the resin identification code.
APR’s November 2024 PET thermoform resource identifies size, shape, color, labels and metal components as sorting factors. Its summary prefers at least two inches in at least two dimensions; the detailed discussion says smaller packs are more likely to fall through screens and should be evaluated after compression. This is design guidance, not a universal MRF loss threshold. [S5]
Dark colors can interfere with near-infrared detection. Large labels can hide the polymer from optical sorting. A package that flattens into a two-dimensional shape may travel through a facility differently from a rigid three-dimensional container.
This is why two packages made from PET can have different recovery outcomes.
The chemistry may be recyclable in both cases. The sorting system does not see chemistry in isolation.
The package that reaches the wrong bale may be worth less than zero
MRFs do not sell “recyclable objects.” They sell commodity streams.
Those streams have quality requirements.
A PET bale contaminated with incompatible polymers, labels, food residue or non-target objects can create:
- lower sale price;
- rejection risk;
- additional sorting cost;
- lower reprocessing yield;
- more residual waste.
EPA’s 2024 assessment of U.S. recycling infrastructure identifies inbound contamination as a system-wide problem affecting operating efficiency, residual contamination and end-product quality. It also notes that contamination can reduce commodity quality and prices. [S2]
So one package can impose costs on material around it.
That is why design-for-recycling guidance pays so much attention to labels, pigments, adhesives and attached components that may look trivial at the package level.
Yield loss is where “collected” stops meaning “recycled”
Collection data are often mistaken for recycling output.
They are not the same.
At a reclaimer, some incoming mass becomes clean secondary material. Some becomes fines, labels, caps, moisture, contamination or process residue.
NAPCOR’s 2024 PET Recycling Report illustrates the distinction. For U.S. and Canadian PET reclamation, the ratio of recovered outputs to incoming material increased from 81.5% in 2023 to 85.2% in 2024. [S6]
NAPCOR says this aggregate ratio includes greater recovery and recirculation of byproducts and increased non-traditional feedstocks. It is not a finished rPET-resin yield for an individual bottle bale, nor the share of all discarded bottles recycled. [S6]
It also shows why one tonne arriving at a reclaimer is not automatically one tonne of saleable recycled resin.
For unit economics, the denominator that matters is usable output.
For one processor and a stated period, an editorial cost allocation is:
effective feedstock cost per usable tonne = total incoming-feedstock cost ÷ usable recovered output.
Lower yield raises the effective cost even when the purchase price of the incoming bale does not change.
Hypothetical example: USD 100 of bale purchases producing 0.80 tonnes of saleable material implies USD 125 of feedstock cost per saleable tonne; at 0.50 tonnes it is USD 200. Processing and disposal costs are additional. No facility price or yield is being reported.

Transport can overwhelm low-value, low-density material
Recovered packaging does not usually become a new product at the MRF.
It has to reach a mill, reclaimer, smelter or other end market.
That means value per truckload matters.
Material that is bulky, light or geographically dispersed can carry high transport cost relative to commodity value. Densification helps, but baling itself requires equipment, labor and enough throughput to justify the operation.
EPA’s recycling infrastructure work treats generation, collection, sortation and end markets as connected stages rather than separate policy problems. Its market-opportunity map also shows that processing and end-market infrastructure are geographically uneven. [S2] [S3]
A package may therefore be economically attractive in one region and unattractive in another even when the material is identical.
The recycler still needs someone to buy the output
A recycling system can collect clean material efficiently and still face an economic problem at the final step.
Secondary material needs an end market.
EPA’s National Recycling Strategy identifies reduced markets for recycled materials as one of the major challenges facing the U.S. system and makes stronger recycled-commodity markets a central objective. [S1]
The OECD describes the same problem for plastics from a different angle.
Historically, secondary plastic has often competed with virgin resin as a substitute. Its market price can therefore move with virgin polymer prices even though a recycler still has to pay for collection, sorting and processing. [S8]
If virgin resin becomes cheap, recycled material can become less competitive without any change in the technical recyclability of the package.
This is the core economic problem:
recycling cost is driven by the recovery system; recycled-material value may be driven by a different market.
PET shows why “same resin” does not mean “same recycling economics”
PET bottles have a relatively mature collection and end-market system in North America.
NAPCOR reported a 30.2% U.S. PET bottle collection rate in 2024 and a 39.2% North American rate. [S6]
PET thermoforms are improving, but they remain a useful contrast.
NAPCOR reported 264 million pounds of PET thermoforms collected for recovery in the U.S. and Canada in 2024, up 52% from the previous year. Yet the organization also noted that demand for recovered thermoform material remained inconsistent. [S6]
The material family is the same.
The package format, collection history, bale composition and end-market demand are not.
That is why a resin code alone cannot answer the economics question.
Paper has the opposite lesson: a strong material system does not guarantee every paper format
Paper and cardboard have large, established recovery markets in the United States.
AF&PA reported that 61–65% of paper available for recovery and 70–75% of cardboard were recycled in 2025. Around 45 million tons of paper were recycled, and nearly half of recovered paper went into containerboard. [S9]
Those are strong system-level numbers.
But they should not be transferred automatically to every fiber foodservice package.
AF&PA also notes that the majority of U.S. communities do not accept paper foodservice packaging in their recycling programs. Paper cups are technically recyclable at mills that can process them, and roughly 40 North American mills are reported to recycle paper cups, but local collection acceptance remains uneven. [S11] [S12]
So the statement:
“Paper recycling rates are high.”
does not prove:
“This coated food container will be economically recovered where it is sold.”
Even a recycling-rate calculation has to decide what counts as usable material
AF&PA’s updated recycling-rate methodology makes another useful point.
Its calculation deducts estimates for material in recovered-paper bales that is not actually used in manufacturing, including unsuitable paper, non-paper material and net moisture. [S10]
That is a methodological detail with a larger implication:
gross bale weight is not the same as recoverable manufacturing feedstock.
The same principle applies across material systems. Recovery economics improve when more of the collected mass becomes specification-quality output.
Small formats can lose before commodity value is even considered
Package size creates another problem that is easy to miss in material-selection meetings.
Very small items may be technically compatible with a recycling process but too small to be captured by the sorting system.
That can affect lids, pods, sachet components, small cups and closures depending on the facility and how the item behaves after compaction.
The economic consequence is straightforward:
if the format is systematically lost to residue, its downstream commodity value never has a chance to offset collection and sorting cost.
Food residue is not one universal “contamination” rule
Foodservice packaging is particularly vulnerable to oversimplification.
Some contamination is tolerable in some systems. Other contamination can lower bale quality or interfere with processing.
For example, the U.S. paper industry says the grease and cheese typically found on pizza boxes are not inherently a barrier to paper recycling, while local programs still differ in what they accept. [S11]
The correct procurement question is therefore not:
“Does food contamination make it unrecyclable?”
It is:
“What contamination level can the actual sorting and reprocessing system tolerate for this format?”
Policy can change the economics without changing the package
A package may be economically weak under a system funded mainly by commodity revenue and municipal budgets.
The same package may become more recoverable if policy changes who pays.
Extended producer responsibility can fund collection, sorting and system improvements. Deposit systems can raise capture and produce cleaner streams. Recycled-content requirements can strengthen demand for secondary material. Landfill or disposal costs can change the alternative-cost calculation.
None of those policies changes the polymer chemistry.
They change the business case around it.
This is why “economically recyclable” is not a permanent intrinsic property of a package. It depends on geography, policy, infrastructure and market conditions.
Five numbers tell more than a recyclability logo
| Variable | What to measure | Why it matters |
|---|---|---|
| Capture | Share of generated material entering the intended recovery stream | No captured material means no recycling economics |
| MRF recovery | Share successfully sorted into the target commodity | Size, shape, labels and contamination create losses |
| Reprocessing yield | Usable secondary output per unit of incoming bale | Yield determines effective feedstock cost |
| Net commodity value | Sale value after quality deductions and transport | Revenue must support the chain |
| End-market depth | Number, scale and stability of buyers for the recovered material | One fragile buyer is not a resilient market |
Original editorial diagnostic matrix. Capture, sorting recovery, reclaimer total outputs, saleable-resin yield and national recycling rates have different denominators. [S2] [S4] [S5] [S6] [S8]
What buyers should ask before calling a package “economically recyclable”
For a specific sales geography:
- Is the format accepted in collection programs?
- Can MRF equipment reliably sort it?
- Which bale does it enter?
- Does it reduce bale quality?
- What proportion becomes usable secondary material?
- How far is the nearest practical end market?
- Who buys the recovered material?
- What happens when virgin-material prices fall?
- Does policy provide a stable demand or funding mechanism?
If those questions cannot be answered, a technical recyclability claim may still be valid—but the economic recovery case remains unproven.
The uncomfortable conclusion
Recyclability is not a finish line.
It is the first gate into an operating system.
A package can be chemically compatible with recycling and still be lost because people do not have access, the item is too small, a label defeats optical sorting, the bale is contaminated, reprocessing yield is poor, transport is expensive or no end market wants the output at a viable price.
The reverse is also true. Better design, denser collection, cleaner sorting, stronger recycled-content demand and policy funding can make the economics improve without changing the basic material.
So the commercially useful question is not:
“Can this package be recycled?”
It is:
“Can this package be captured, sorted, reprocessed and sold at sufficient scale in the market where it will actually be discarded?”
Methodology and editorial note
This is a source-led economic explanation using official infrastructure analysis, industry methods and recycling-release summaries. The NAPCOR paid full report was not examined. Its aggregate total recovered-output ratio is not used as saleable-resin yield. The USD100 example is explicitly hypothetical; no plant margin, local acceptance or universal processing cost is claimed. Sources checked 19 October 2026. No supplier audit, factory inspection or independent market census was performed for this article.
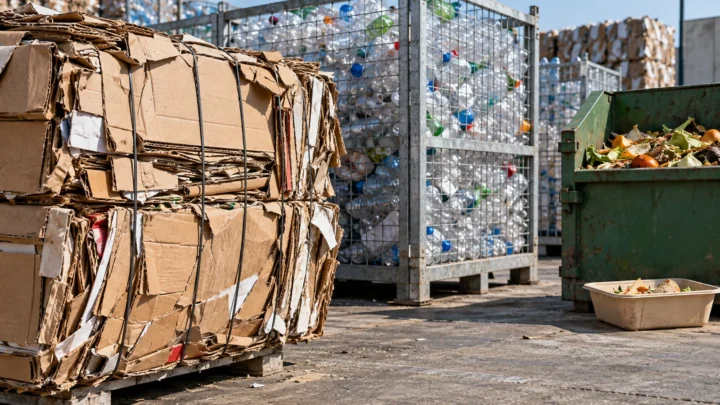
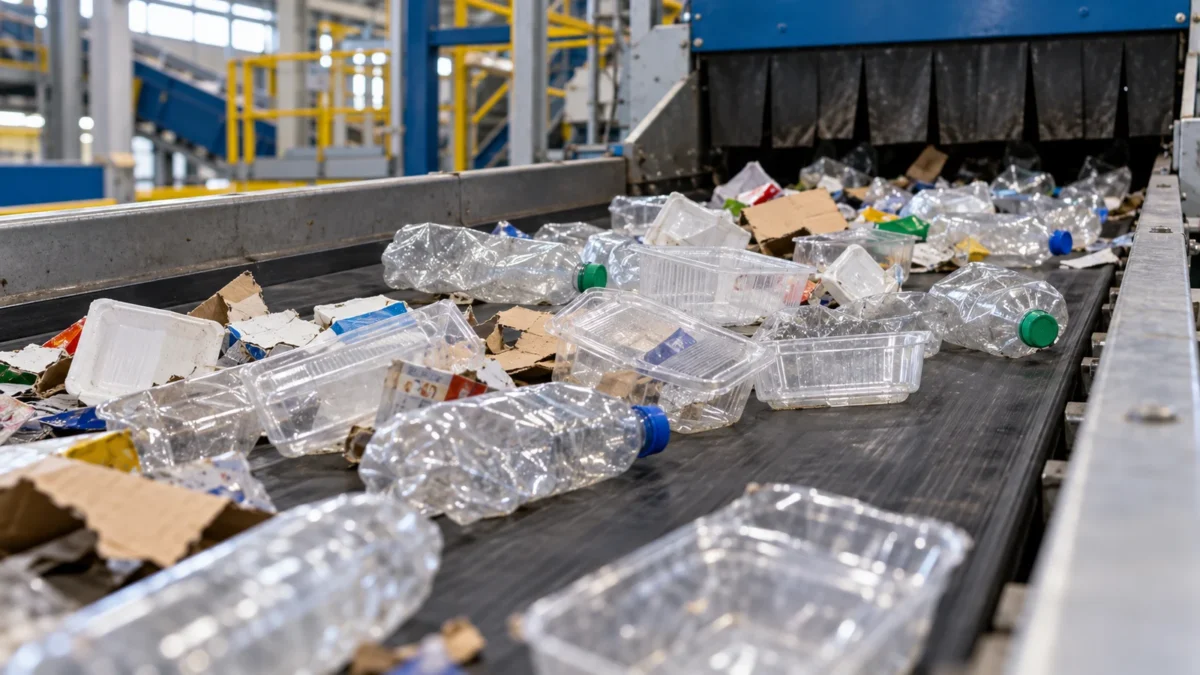
The main image is an AI-generated editorial illustration of a generic scene, not a real named company, product, experiment or facility. The in-body figure is an original source-grounded synthesis or labelled calculation.
Official sources and reference notes
- [S1] U.S. Environmental Protection Agency. National Recycling Strategy. Current public record checked 19 October 2026. Five recycling-system challenges and commodity-market objective. Relevant original public record read; scope remains attributed. Accessed 19 October 2026.
- [S2] U.S. EPA. An Assessment of the U.S. Recycling System: Financial Estimates to Modernize Material Recovery Infrastructure. EPA 530-R-24-010, August 2024. Executive summary; collection, processing, contamination and end-market sections. Relevant original public record read; scope remains attributed. Accessed 19 October 2026.
- [S3] U.S. EPA. Recycling Infrastructure and Market Opportunities Map. 2.0 updated June 2025. Map introduction; geography and system stages. Relevant original public record read; scope remains attributed. Accessed 19 October 2026.
- [S4] The Recycling Partnership. 2024 State of Recycling Report – The Recycling Partnership. Current public record checked 19 October 2026. Report overview and household material-loss analysis. Relevant original public record read; scope remains attributed. Accessed 19 October 2026.
- [S5] Association of Plastic Recyclers. RES-PET-01 PET Thermoform Packaging Design. November 2024. November 2024 resource pp4 and9; size, compression, shape, color and labels. Official 23-page PDF read through public reader; relevant pp4 and9 inspected. Accessed 19 October 2026.
- [S6] National Association for PET Container Resources. NAPCOR Releases 2024 PET Recycling Report Highlighting System Efficiency Gains and Continued Strength of PET Circularity – NAPCOR. 10 Dec 2025. December 10 release: collection, thermoforms, total recovered outputs and non-traditional feedstocks. Original public release and methods summary; paid full recycling report not examined. Accessed 19 October 2026.
- [S8] OECD. Global Plastics Outlook: Economic Drivers, Environmental Impacts and Policy Options. 2022; DOI 10.1787/de747aef-en. Chapter Trends in the secondary plastics markets; price linkage and market fragility. Relevant original public record read; scope remains attributed. Accessed 19 October 2026.
- [S9] American Forest & Paper Association. Paper Industry Announces 2025 U.S. Paper Recycling Rates. 28 Aug 2026. 2025 rates and recovered-paper destinations. Relevant original public record read; scope remains attributed. Accessed 19 October 2026.
- [S10] AF&PA. AF&PA Recycling Rate Methodology. Current public record checked 19 October 2026. Calculation adjustments: unused material, contamination, moisture and range estimates. Relevant original public record read; scope remains attributed. Accessed 19 October 2026.
- [S11] AF&PA. What Types of Paper Can Be Recycled?. Current public record checked 19 October 2026. Foodservice packaging and pizza-box acceptance. Relevant original public record read; scope remains attributed. Accessed 19 October 2026.
- [S12] AF&PA. Can Paper Cups be Recycled?. Current public record checked 19 October 2026. Paper-cup mill capability and local collection distinction. Relevant original public record read; scope remains attributed. Accessed 19 October 2026.
The public corrections channel is currently inactive. Read our corrections policy.