The recovery market did not move in one direction in 2026.
Recovered paper became more valuable. PET bottle bales stayed painfully weak. Compostable packaging did not develop a commodity market comparable with either one; instead, its economics continued to depend on facility acceptance, organics collection and infrastructure investment.
That divergence is the useful signal.
If all three are placed in one “circular packaging” chart, the economics disappear.
Fiber: the bale got more valuable even as mill use fell
U.S. recovered-paper prices strengthened materially between April and October.
RecyclingMarkets.net data reported through Resource Recycling put the national average for old corrugated containers, PS 11, at roughly USD 58–60 per ton in April. By October, OCC was averaging about USD 91 per ton. [S1] [S5]
Using the two ends of the reported April range, USD 91 is about 51.7–56.9% higher. This is our endpoint calculation, not a reported continuous return or an estimate of recycler margins. [S1] [S5]
Other paper grades also strengthened. Sorted residential paper moved from about USD 36 per ton in April to USD 50–55 in October. Mixed paper moved from roughly USD 21–22 to USD 35–40. [S1] [S5]
These are the provider’s U.S. national observations for sorted, baled post-consumer material picked up at major recycling centers. Paper prices retain its USD per “ton” wording: the retrieved pages do not define the ton mass, so no metric-tonne conversion is made. PET is U.S. cents per pound. Neither is a finished-packaging or saleable-rPET price. [S1] [S2] [S4] [S5]
Still, the direction matters: recovered fiber entered the fourth quarter with stronger bale economics than it had in spring.
But higher bale prices did not mean every paper-market indicator strengthened
AF&PA’s August 2026 recycling release showed that the United States recycled around 45 million tons of paper in 2025, with a paper recycling rate of 61–65% and a cardboard rate of 70–75%. [S6]
Nearly half of recovered paper went into containerboard.
At the same time, U.S. mills used 31.4 million tons of recycled paper in 2025—1.3 million tons less than in 2024. [S6]
That combination is worth keeping intact.
High recovery rates and rising bale prices can coexist with lower domestic mill consumption.
Recovered paper is also exported, and different grades have different buyers. A strong OCC market therefore should not be translated into “all recovered fiber demand is booming.”
PET: a summer bounce did not restore prior-year prices
The PET story was almost the opposite.
The national average price for post-consumer PET beverage bottles and jars was only 1.44 cents per pound in April 2026. [S1]
It improved to 2.24 cents in May, 2.86 cents in June and 3.20 cents in July. [S2]
By September it was back to 2.61 cents. In October it slipped again to 2.53 cents per pound. [S4] [S5]
For comparison, the October 2025 average was 4.50 cents per pound. [S5]
So the market did recover from the extraordinary April low.
October’s observation was still 43.8% below the October 2025 value, even though it stood 75.7% above April’s low. Those are price comparisons; the series alone cannot establish a healthy margin or a universal break-even price.
The national PET number also hid a freight map
During the summer, regional values diverged sharply.
Resource Recycling reported July PET bale pricing of about 7–8 cents per pound in the U.S. South and Southeast. In August, that region was still around 6–7 cents, while Midwest values were below 3 cents. [S3]
The difference was not simply polymer quality.
Distance to reclaimers and diesel costs mattered.
A bale can be worth more near conversion capacity because less of its commodity value is consumed by transport.
This is the recovery-economics framework appearing in a current regional market:
the same PET bottle bale can have different economics because the end market is in a different place.
Weak PET bale values were accompanied by pressure on domestic reclamation capacity
In September, U.S. lawmakers asked the U.S. Trade Representative to consider the domestic recycled-PET sector in trade investigations.
Their letter, as reported by Resource Recycling, cited industry data indicating that seven of roughly 30 U.S. PET reclaimers had closed over the prior 12 months and that more than one-quarter of domestic PET recycling capacity had been lost. [S7]
That is industry-supplied evidence relayed through lawmakers, not an audited federal capacity census.
It should be treated accordingly.
But it is consistent with the price signal: a recyclable material can face weak recovery economics even while brands, states and packaging policies call for more recycled content.
Why the PET contradiction matters
The system can simultaneously have:
- recycled-content targets;
- design-for-recycling programs;
- collection infrastructure;
- and weak bale values.
Those conditions are not mutually exclusive.
Reclaimers still compete with virgin resin, imported material, energy costs, labor, freight and financing.
A demand mandate may strengthen long-term economics, but it does not guarantee that every domestic reclaimer has positive margins in every month.
Compostables: there is no equivalent “bale price” to watch
Compostable packaging is often discussed beside recycled paper and recycled plastics, but the market mechanism is different.
A composter does not normally buy sorted compostable cups or trays as a commodity feedstock in the same way a mill buys OCC or a plastics reclaimer buys PET bales.
The package generally has value only as part of an organics-management system.
Its economics therefore depend on questions such as:
- Is food waste collected?
- Does the receiving composter accept certified packaging?
- Can the facility process the product within its residence time?
- Does packaging help capture food scraps or create contamination?
- Who pays for collection and processing?
- Is the resulting compost marketable?
That is why no honest six-month update should place “compostable packaging price” beside OCC and PET bale prices as if they were equivalent recovery commodities.
May 2026 made the infrastructure problem more explicit
The U.S. Plastics Pact’s May report on composting policy argued that compostable packaging only delivers system value when it is paired with collection infrastructure, clear acceptance criteria and composting capacity. [S8]
The report highlighted settings such as stadiums, festivals and airports, where food and packaging are difficult to separate and accepted compostable packaging can help move food-contaminated material into organics recovery. [S8]
That is a narrower use case than “compostables solve foodservice waste.”
It is also more credible.
The economic value comes from helping the organics system capture food waste—not from the empty package having a high commodity price.
The standard tightened while the infrastructure was still catching up
In its 11 September update, BPI reported that ASTM’s D20 committee had approved two D6400 revisions to strengthen biodegradation requirements for plastics intended for municipal or industrial aerobic composting.
BPI’s summary said the revisions expand the range of constituents that must independently demonstrate biodegradability and reduce material eligible for testing allowances. [S9]
For composters, a stricter technical baseline can improve confidence in certified products.
But a stronger standard does not create collection routes, processing capacity or facility acceptance by itself.
Certification and infrastructure solve different parts of the problem.
Public money is still being used to build the organics side of the system
EPA’s Solid Waste Infrastructure for Recycling program continued making infrastructure selections in 2026.
EPA’s July 2026 announcements describe second-round Tribal recycling-infrastructure selections. The national count cited in the handoff was not independently recovered from the selected regional notices, so it is not reproduced here.
That matters because organics recovery economics are capital intensive before the first compostable foodservice item is accepted.
EPA’s broader infrastructure assessment has estimated that tens of billions of dollars of investment are needed across U.S. collection and processing systems, including recycling, composting and anaerobic digestion. [S13]
The current grant activity is therefore a capacity-building signal, not evidence that compostable packaging now has universal access.
EPR is starting to move recovery economics onto the producer’s P&L
Another important six-month change came from packaging extended producer responsibility.
California’s permanent SB 54 regulations took effect on 1 May 2026. On 13 October, CalRecycle received the producer responsibility organization’s revised program plan for statewide implementation. [S11]
The system is designed to move more of the cost of packaging recovery from local governments and ratepayers toward producers.
Oregon is already further into that transition. Producers of covered packaging and foodservice ware are reporting supply data and paying producer-responsibility fees, and Oregon’s program allows certain private-recycling exemptions only when producers can demonstrate responsible downstream recycling. [S12]
These programs do not make every package economically recyclable.
They change who funds collection, sortation and system improvement—and that changes the economic boundary.
California also shows why recovery performance is becoming a market-access issue
CalRecycle’s current implementation page says EPS foodservice-ware producers had to demonstrate a 25% recycling rate as of 1 January 2025. It says the requirement has not been met. [S11]
The regulator therefore describes a prohibition on producers selling, offering for sale, distributing or importing covered EPS foodservice ware in California. This is a scoped regulator-status report, not a package-specific compliance opinion. [S11]
This is an unusually direct connection between recovery performance and market access.
For packaging companies, the implication is larger than EPS:
recovery economics are moving from sustainability reporting into product-market rules.

Three recovery systems, three different 2026 stories
| System | Six-month signal | Economic reading | Do not infer |
|---|---|---|---|
| Recovered fiber | OCC rose from roughly USD 58–60 per source ton in April to about USD 91 per source ton in October | Stronger bale value / end-market economics | All paper formats or mills are equally strong [S1] [S5] |
| PET bottles | National bale value moved from 1.44¢/lb in April to 2.53¢/lb in October, still below prior-year October | Partial bale-price rebound; no direct margin measurement | PET is technically unrecyclable [S1] [S5] |
| Compostables | Standards tightened while infrastructure grants and policy work continued | System value depends on organics capture, acceptance and processing capacity | Certification equals facility access [S8] [S9] [S10] |
| EPR | California regulations became effective; Oregon producer fees/reporting continued | More recovery cost is being assigned upstream to producers | EPR guarantees profitable recycling [S11] [S12] |
Different systems, not one comparable recovery score. Price observations are credited to RecyclingMarkets.net’s own column in Resource Recycling; the separate reclaimer-closure report is secondary journalism. Prices do not measure net margins. “Ton” remains the source’s undefined mass unit.
What changed—and what did not
Recovered fiber improved economically during the period.
PET remained under pressure despite a spring-to-summer bounce.
Compostable packaging gained a stricter technical standard and continued infrastructure attention, but still lacks anything resembling the broad commodity-market structure of OCC or PET.
EPR moved further from legislation toward operating economics.
What did not change is equally important:
- a recycling rate still does not equal a commodity price;
- a high commodity price still does not prove local collection;
- a low PET bale price does not mean PET chemistry stopped being recyclable;
- a compostability certificate still does not guarantee a facility will accept the item;
- an EPR fee still does not prove the recovered material has a durable end market.
Recovery-market conclusion
The strongest six-month signal is divergence.
Fiber had a stronger commodity market. PET had a weak one. Compostables remained infrastructure-dependent rather than commodity-price-driven. EPR increasingly changed who bears the cost.
Those systems should not be ranked with one “recovery score.”
They should be measured according to how each one actually creates value:
fiber through recoverable commodity demand, PET through bale-to-resin economics, compostables through organics-system performance, and EPR through cost allocation and infrastructure funding.
That is the more useful recovery-market picture for packaging decisions in late 2026.
Methodology and editorial note
The update retains provider-written national price observations published in Resource Recycling from April to October 2026, plus separately attributed regional reporting and secondary reclaimer-closure journalism. No paywalled underlying pricing dataset or recycler balance sheet was audited. The paper ton convention remains undefined; no metric conversion is made. Prior-year mill data, BPI’s revision summary, dated regulatory status and infrastructure selections are different evidence types. Sources checked 19 October 2026. No supplier audit, factory inspection or independent market census was performed for this article.
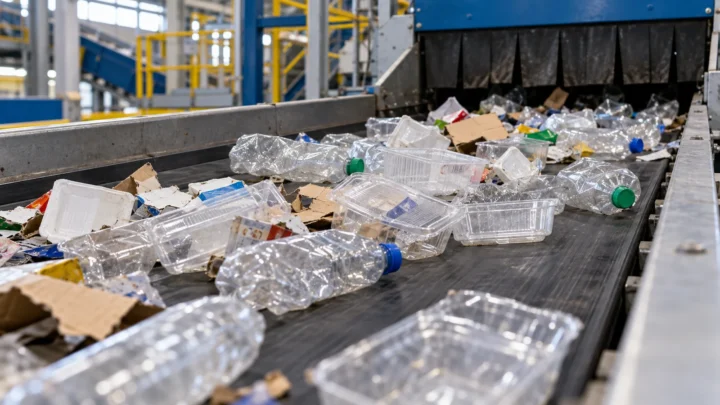
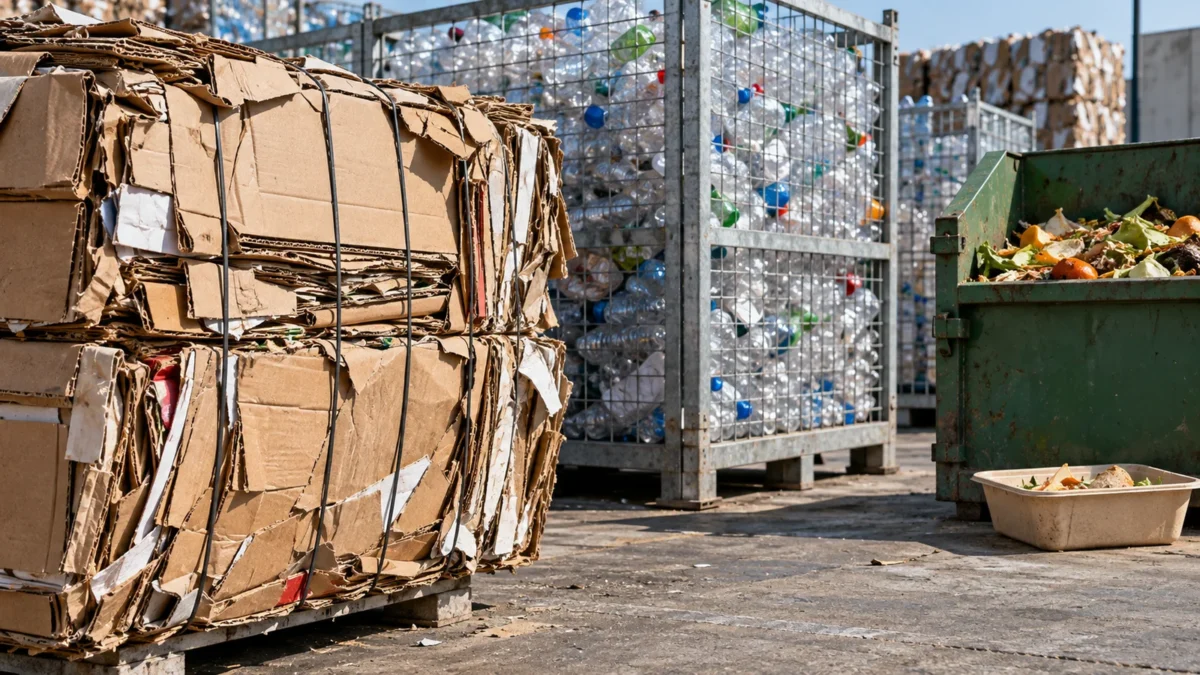
The main image is an AI-generated editorial illustration of a generic scene, not a real named company, product, experiment or facility. The in-body figure is an original source-grounded synthesis or labelled calculation.
Official sources and reference notes
- [S1] RecyclingMarkets.net Secondary Materials Pricing Index. PET bales sink further as other grades firm – Resource Recycling. 15 April 2026. April 15 national PET and paper-grade observations; pickup basis. Relevant original public record read; scope remains attributed. Accessed 19 October 2026.
- [S2] Resource Recycling / RecyclingMarkets.net. Secondary Materials Pricing Index: May, June and July 2026 observations. 11 May,15 June and13 July 2026. May 11, June 15 and July 13 national PET observations, not regional August prices. Relevant original public record read; scope remains attributed. Accessed 19 October 2026.15 June observation. 13 July observation.
- [S3] Resource Recycling. August pricing bearish for plastic bales – Resource Recycling. 17 Aug 2026. August 17 PET regional-market section and freight explanation. Relevant original public record read; scope remains attributed. Accessed 19 October 2026.
- [S4] Resource Recycling / RecyclingMarkets.net. Bale pricing mostly flat for September – Resource Recycling. 9 Sep 2026. September 9 national PET and paper-grade observations. Relevant original public record read; scope remains attributed. Accessed 19 October 2026.
- [S5] Resource Recycling / RecyclingMarkets.net. HDPE, PP prices climb for October – Resource Recycling. 14 Oct 2026. October 14 national PET and paper grades; October 2025 comparator. Relevant original public record read; scope remains attributed. Accessed 19 October 2026.
- [S6] American Forest & Paper Association. Paper Industry Announces 2025 U.S. Paper Recycling Rates. 28 Aug 2026. August 28 release: 2025 recycling rates and mill-use change. Relevant original public record read; scope remains attributed. Accessed 19 October 2026.
- [S7] Resource Recycling. US lawmakers urge protection of domestic RPET – Resource Recycling. 25 Sep 2026. September 25 report of lawmakers’ letter and attributed industry closures. Relevant original public record read; scope remains attributed. Accessed 19 October 2026.
- [S8] U.S. Plastics Pact. Enabling Composting at Scale: Policy Drivers for Composting Infrastructure and Compostable Packaging Acceptance. May 2026. Policy report: organics infrastructure, acceptance, collection and procurement settings. Relevant original public record read; scope remains attributed. Accessed 19 October 2026.
- [S9] Biodegradable Products Institute summary of ASTM action. BPI – Compostable Products Standard Revised. 11 Sep 2026. September 11 BPI summary of approved revisions, not detailed standard clauses. Relevant original public record read; scope remains attributed. Accessed 19 October 2026.
- [S10] U.S. EPA. EPA Grants $2.14 Million to Pueblo of Isleta and Pueblo de Cochiti for Solid Waste Infrastructure for Recycling. 29 Jul 2026. July 29 regional SWIFR selections and named infrastructure examples. Relevant original public record read; scope remains attributed. Accessed 19 October 2026.
- [S11] CalRecycle. SB 54: Plastic Pollution Prevention and Packaging Producer Responsibility Act – CalRecycle Home Page. Current public record checked 19 October 2026. Program News May 1 and October 13; EPS current regulator statement. Relevant original public record read; scope remains attributed. Accessed 19 October 2026.
- [S12] Oregon Department of Environmental Quality. Department of Environmental Quality : Producers of Covered Products : Recycling : State of Oregon. Current public record checked 19 October 2026. Producer registration/reporting/fees; defined exemptions. Relevant original public record read; scope remains attributed. Accessed 19 October 2026.
- [S13] U.S. EPA. An Assessment of the U.S. Recycling System: Financial Estimates to Modernize Material Recovery Infrastructure. EPA 530-R-24-010, August 2024. EPA 2024 infrastructure assessment, structural context only. Relevant official assessment PDF sections read; older structural estimate. Accessed 19 October 2026.
The public corrections channel is currently inactive. Read our corrections policy.