
Two food containers can use similar raw materials and still produce very different quotations.
One supplier quotes a lower unit price. Another quotes more per piece but packs more efficiently, uses less material, has lower scrap, needs no new tooling and ships closer to the destination market.
The lower factory price may still be the higher-cost purchase.
This is the pricing rule that matters most in sustainable packaging:
raw-material price is not package price, package price is not landed cost, and landed cost is not always cost per usable package.
A credible comparison has to reconstruct the cost stack.
Cost layer 1 — start with the material, but do not stop there
Raw material is usually one of the largest direct cost inputs, but “material cost” means different things for different packaging systems.
For a polymer package, the material layer can include:
- base resin;
- blend partners;
- masterbatch or pigment;
- nucleating agents or tougheners;
- barrier additives;
- processing aids;
- recycled-content premium or discount;
- drying losses and regrind rules.
For paper and molded fiber, it can include:
- virgin or recycled fiber;
- fiber preparation or pulping;
- wet-strength chemistry;
- grease or water barrier;
- coating weight;
- mineral fillers;
- basis weight or grams per finished article.
The number that matters is therefore not simply “PLA price per kilogram” or “pulp price per tonne.”
It is the material cost embedded in the finished specification.
PBAT adds a different feedstock chain again: the specified polyester grade and blend partners matter, rather than an agricultural-feedstock assumption based on the word “biodegradable.” The PBAT materials explainer establishes that distinction; it does not supply a current transaction price.
Cost layer 2 — the same resin can create different package costs
Consider two PLA packages using the same nominal resin grade.
One is a clear, thin thermoformed cold-food container. Another is a crystallized heat-resistant article using nucleation, mineral filler, a different thermal cycle and a higher finished weight.
The resin family is the same, but the conversion economics are not.
The heat-resistant PLA analysis explains the crystallization engineering. Economically, that can affect:
- compound cost;
- drying requirement;
- cycle time;
- mold temperature;
- cooling or annealing;
- scrap management;
- finished weight.
That is why buyers should compare the exact grade and finished construction, not a generic polymer name.
Cost layer 3 — PHA demonstrates why production pathway matters
PHA pricing cannot be understood only as a polymer-per-kilogram comparison.
PHA is produced biologically, so production economics include the carbon substrate, fermentation productivity, organism performance, recovery and purification.
Recent peer-reviewed reviews consistently identify feedstock and downstream recovery as major contributors to PHA production cost. Several reviews also show that lower-cost waste-derived substrates and improved continuous or high-productivity fermentation are being studied specifically because current production economics remain a commercialization constraint. [S8] [S9]
This does not justify one universal PHA cost number. Published techno-economic estimates vary widely with:
- substrate;
- fermentation yield;
- plant scale;
- recovery technology;
- energy;
- product purity;
- country and year.
The defensible sourcing question is:
which PHA grade, produced at what scale and converted into which package?
Cost layer 4 — molded fiber converts water removal into money
Molded fiber has a different cost structure.
The process begins with a wet fiber suspension. Water has to be removed through forming, dewatering, pressing and drying before the package becomes dimensionally stable.
That matters economically because drying is energy-intensive.
The open-access BioResources review identifies dewatering, drying and production rate as key molded-pulp constraints. A separate 2025 drying assessment covers the broader U.S. pulp-and-paper sector; its sector-level energy estimates cannot be assigned directly to a bagasse tray. [S5] [S7]
For molded fiber, cost can therefore change with:
- fiber type and fiber yield;
- pulp consistency;
- dewatering efficiency;
- product thickness;
- hot-press time;
- drying temperature;
- tool configuration;
- barrier chemistry;
- reject rate.
A heavier bagasse tray can cost more even when pulp price is unchanged simply because it contains more dry fiber and requires more water removal and thermal processing.
Cost layer 5 — barrier performance is a costed function
A package that only holds dry bakery items does not require the same barrier architecture as a tray holding hot oil, sauce or soup.
Barrier performance may add cost through:
- coating chemistry;
- coat weight;
- extra drying;
- surface preparation;
- multiple coating passes;
- additional quality control;
- lower line speed;
- higher reject risk.
The barrier-performance explainer distinguishes grease, liquid water, oxygen transmission rate (OTR) and water-vapour transmission rate (WVTR).
The pricing consequence is straightforward:
a “better barrier” specification is not one line item. It can change chemistry, process time, energy use and yield at the same time.
Cost layer 6 — conversion yield can matter more than a small material-price difference
Packaging plants do not convert every kilogram of purchased material into sellable packages.
Losses can come from:
- start-up scrap;
- trim and skeleton waste;
- color or print changeover;
- forming defects;
- warpage;
- coating defects;
- contamination;
- dimensional rejects;
- quality sampling.
Some scrap can be reprocessed internally. Some cannot, especially where food-contact rules, color, thermal history or contamination limit reuse.
A plant with higher material yield can therefore offer a competitive package price even when its resin or pulp input is not the cheapest.
Yield belongs in the cost model.
Consider a hypothetical 20 g package made from material costing USD 3/kg. With no scrap credit, material cost is USD 0.0632 per good unit at 95% net material yield, versus USD 0.0750 at 80%: 0.020 × 3 ÷ yield. That 18.75% increase is arithmetic from stated assumptions, not an observed factory cost. Regrind credits, additives, energy and conversion remain outside this example.
Cost layer 7 — cycle time prices the machine
A packaging machine costs money even when raw material is cheap.
If one mold produces fewer pieces per cycle, requires longer cooling, longer drying or more frequent cleaning, machine cost is spread over fewer sellable units.
Conversion economics therefore depend on:
- cavities per tool;
- cycles per minute;
- forming speed;
- drying time;
- changeover time;
- downtime;
- maintenance;
- automation level.
This is why laboratory formulations with excellent barrier or compostability performance may still struggle commercially: slow processing can overwhelm a raw-material advantage.
Cost layer 8 — energy is both direct cost and process constraint
Electricity, steam, gas and thermal energy affect different packaging processes in different ways.
Extrusion, thermoforming, injection molding, drying, hot pressing, coating and printing all consume energy.
Official U.S. Energy Information Administration data show industrial electricity prices changing over time. Table 5.3 is a national series, not a regional factory tariff or an energy-cost-per-package measure. [S3]
Energy sensitivity is especially important where the process includes:
- water evaporation;
- high-temperature drying;
- chilled-water cooling;
- compressed air;
- vacuum forming;
- long heat-treatment cycles.
Cost layer 9 — labor and automation change the conversion cost
Labor is not only the operator standing beside a machine.
Packaging conversion also needs:
- tool setup;
- maintenance;
- quality inspection;
- packing;
- warehouse handling;
- printing preparation;
- documentation;
- rework and sorting.
The U.S. Bureau of Labor Statistics publishes manufacturing compensation indices, which track labor-cost movement rather than the labor required for a particular package. Automation, staffing and output per hour still have to be assessed for the line being quoted. [S4]
A highly automated high-volume line and a semi-automatic small-batch line should not be expected to have the same unit economics.
Cost layer 10 — MOQ changes the price even if nothing about the package changes
Many packaging costs are fixed or semi-fixed per production run.
Examples include:
- tooling;
- printing plates or cylinders;
- ink setup;
- machine cleaning;
- color matching;
- artwork approval;
- quality setup;
- carton setup;
- test reports;
- production scheduling.
When quantity falls, these costs are divided over fewer units.
That is why a quote for 10,000 custom-printed units cannot be compared directly with a quote for 500,000 plain units by simply dividing total price by pieces.
MOQ is partly a commercial policy, but it also reflects real batch economics.
Cost layer 11 — compliance has fixed costs and recurring costs
Evidence costs depend on the destination, construction and claim. Mandatory food-contact or chemical requirements must be distinguished from voluntary certification and customer specifications. A buyer’s documentation file may cover:
- food-contact compliance;
- migration;
- PFAS or other restricted substances;
- compostability;
- recycled content;
- quality-management systems;
- traceability;
- customer-specific testing.
Some of those costs are paid once per formulation, tool or certification cycle. Others recur with production, auditing or document renewal.
Two visually identical containers can therefore have different cost structures because one has a more extensive documented compliance package.
Compliance evidence should not be treated as free overhead.
Cost layer 12 — packaging the packaging matters
Disposable food packaging is often low in weight but high in volume.
A carton filled with cups, clamshells or trays can reach its cube limit long before it reaches a container’s weight limit.
Freight cost per piece therefore depends heavily on:
- nesting;
- carton dimensions;
- pieces per sleeve;
- pieces per carton;
- carton strength;
- palletization;
- container utilization.
A slightly heavier package can sometimes ship more economically if it nests better.
Conversely, a very light but bulky package can have a high freight cost per unit.
Cost layer 13 — freight is volatile, and quote basis matters
UN Trade and Development’s public summary of its 2025 maritime review warns that rerouting and longer journeys raise costs and increase uncertainty. That is background context, not a current freight quote for a packaging shipment. [S10]
For packaging buyers, that means:
EXW, FOB, CIF and delivered prices answer different questions. [S11]
A factory quote can exclude:
- origin transport;
- port charges;
- ocean freight;
- insurance;
- destination handling;
- customs brokerage;
- duty;
- domestic delivery.
Comparisons should normalize the Incoterm and destination before declaring one supplier cheaper.
Cost layer 14 — inventory has a financing cost
Long lead times and high MOQs tie up cash.
A buyer may have to hold more inventory when:
- production is offshore;
- custom printing extends lead time;
- shipping is volatile;
- seasonal demand is unpredictable;
- one SKU can only be ordered in large batches.
Inventory creates warehouse, financing, obsolescence and forecasting risk.
A higher unit price from a regional supplier can therefore be commercially rational if it materially reduces working capital or obsolete stock.
Cost layer 15 — recycled content is not automatically the low-cost option
Recycled material can reduce dependence on virgin feedstock, but its economics depend on collection, sorting, cleaning, decontamination, quality and supply.
For food-contact applications, the usable recycled feedstock pool can be narrower than the general recycling stream.
Cost can therefore be affected by:
- bale quality;
- contamination;
- washing and sorting yield;
- decontamination technology;
- certified chain of custody;
- color specification;
- regulatory qualification;
- regional supply-demand balance.
“Recycled” is an input description, not a guaranteed price discount.
What official price indices can—and cannot—tell you
Official producer-price indices are useful because they show how categories of producer prices move over time.
The U.S. Bureau of Labor Statistics publishes separate series for categories such as plastic packaging products, paper boxes and containers, folding paperboard packaging and packaging paperboard. [S2]
That is useful for market direction.
But an index is not a supplier quotation.
It does not tell a buyer:
- the price of a particular PLA grade;
- the price of a particular bagasse tray;
- the cost of custom printing;
- FOB or landed freight;
- the effect of MOQ;
- the cost of a specific certification package.
The 2026 feedstock dashboard applies the rule: do not substitute an index for a product quote, and do not substitute a product quote for a market index.

The full cost stack
| Cost layer | Examples | Why quotations differ |
|---|---|---|
| Material | Resin, pulp, recycled content, additives | Grade, composition, weight and market price |
| Functional chemistry | Barrier, wet strength, pigment, toughener | Performance specification |
| Conversion | Extrusion, forming, molding, drying, coating | Cycle time, energy and machine utilization |
| Yield | Trim, start-up waste, rejects | Usable output per input kilogram |
| Customization | Tooling, printing, color, artwork | Fixed costs divided across order quantity |
| Compliance | Food contact, migration, certification, testing | Scope and documentation requirements |
| Secondary packing | Sleeves, cartons, pallets | Protection and cube efficiency |
| Freight | Origin, ocean, destination transport | Route, Incoterm, cube and rate volatility |
| Inventory | Safety stock, storage, financing | MOQ and lead-time exposure |
| Loss / quality risk | Damage, rejects, obsolete stock | Supplier consistency and specification fit |
Conceptual cost categories, not measured shares; some quotation lines already include other layers. Check inclusion before adding costs. Voluntary certifications are not interchangeable with legal compliance. [S5] [S8] [S11]
A better buying metric: landed cost per usable unit
A practical sourcing comparison should normalize quotations to the same commercial boundary.
One useful model is:
Total acquisition cost per usable unit = total included acquisition costs ÷ usable units received. Use a narrower “landed cost” label only when the numerator is restricted to the company’s defined delivery/import boundary.
Total acquisition cost can include, where relevant:
- goods;
- tooling amortization;
- printing setup;
- packing;
- freight;
- duty and brokerage;
- domestic transport;
- inventory financing;
- expected reject or damage allowance.
Count an unusable purchased unit through the usable-unit denominator; do not add its already-paid purchase cost again as a separate loss. Include only distinct additional costs, such as disposal or replacement freight. Exclude recoverable taxes where appropriate and keep financing periods consistent.
The principle does not:
compare like with like.
Cost conclusion
Sustainable packaging prices differ because the buyer is not purchasing a kilogram of resin or pulp.
The buyer is purchasing a converted, documented, packed and delivered performance system.
PLA, PBAT, PHA, recycled plastic, paperboard and molded fiber each bring different raw-material economics. Conversion then adds cycle time, energy, yield, tooling, printing and quality cost. Compliance adds another layer. Logistics can reverse an apparent factory-price advantage. MOQ and inventory can change the cost again.
This is why the question:
“Which sustainable packaging material is cheapest?”
is usually too broad to answer.
The commercially useful question is:
“What is the landed cost per usable package that meets the same performance, compliance, quantity and delivery specification?”
Methodology and editorial note
This is an editorial cost framework, not a supplier quotation or observed cost survey. Technical and economic research is used only within its reported scope. The 20 g / USD3 per kg yield calculation is hypothetical; scrap recovery credits and conversion costs are excluded. Sources checked 19 October 2026. No supplier audit, factory inspection or independent market census was performed for this article.
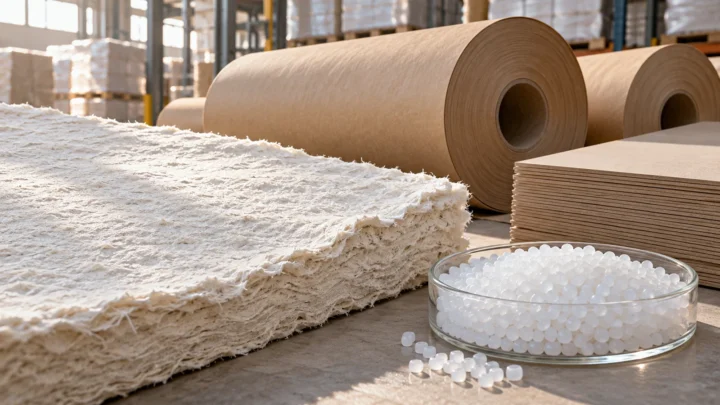
The main image is an AI-generated editorial illustration of a generic industry scene, not a named company, product or real event. The in-body figure is an original source-grounded synthesis or labelled calculation.
Official sources and reference notes
- [S2] U.S. Bureau of Labor Statistics / FRED. Plastics Packaging Products PPI. Monthly, not seasonally adjusted; Index Dec 2006=100. Series WPU072A01; April–September 2026 observations; as retrieved 19 October 2026. Full public table checked. Index levels, not currency prices; recent observations remain subject to revision. Accessed 19 October 2026.
- [S3] U.S. Energy Information Administration. Electric Power Monthly, Table 5.3. July 2026 data; released 24 September 2026. Industrial electricity price time series. Full public table checked; national average, not proof of regional variation or package-level energy cost. Accessed 19 October 2026.
- [S4] U.S. Bureau of Labor Statistics. Employment Cost Index — Q2 2026. 31 July 2026. Manufacturing compensation tables. Relevant official public tables checked via web reader; not factory-specific wages. Accessed 19 October 2026.
- [S5] Debnath, Sarder, Pal and Hubbe / BioResources. Molded pulp products for sustainable packaging: Production rate challenges and product opportunities. 2022; BioResources17(2):3810–3870. Production process; dewatering, pressing and drying; production-rate limitations. Relevant full open-access review checked; not a quotation or bill of materials. Accessed 19 October 2026.
- [S7] da Silva et al. / Oak Ridge National Laboratory. Current state and future projections of drying processes in the US food and pulp and paper sectors. 2025 research article. Pulp/paper drying-energy assessment and scope. Original author-institution full PDF checked; broader sector, not molded tray unit cost. Accessed 19 October 2026.
- [S8] Review authors / Polymers. Toward Sustainable Polyhydroxyalkanoates: A Next-Gen Biotechnology Approach. 2025; 17(7):853. Economic challenges; substrate and downstream recovery. Relevant full open-access review checked; no universal commercial PHA quote inferred. Accessed 19 October 2026.
- [S9] Chouhan and Tiwari / RSC Advances. Production of polyhydroxyalkanoate (PHA) biopolymer from crop residue using bacteria as an alternative to plastics. 2025; DOI10.1039/D4RA08505A. Feedstocks, fermentation and extraction cost constraints. Relevant full open-access review checked; research pathways are not verified industrial cost savings. Accessed 19 October 2026.
- [S10] UN Trade and Development. Review of Maritime Transport 2025: official release summary. 24 September 2025. Public release summary: rerouting, longer journeys and volatile costs. Indexed official summary only; direct page/PDF access returned 403. No report-level numerical claim used. Accessed 19 October 2026.
- [S11] International Chamber of Commerce. Incoterms® 2020: Checklist and Flowcharts. Official checklist; ©2022, file labelled 2024 update. pp4–6 decision checklist; pp7–12 buyer/seller decision flowcharts. Full public PDF checked; brief paraphrase of delivery/cost allocation, not reproduction of paid rule clauses. Accessed 19 October 2026.
The public corrections channel is currently inactive. Read our corrections policy.