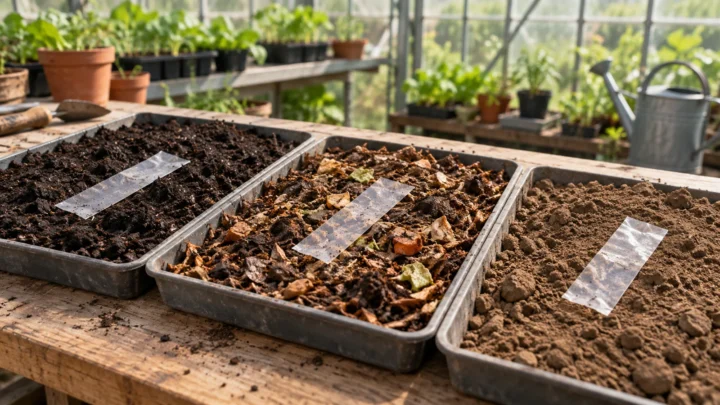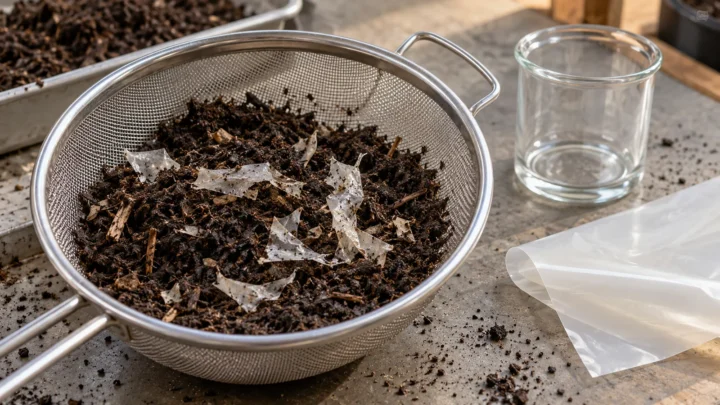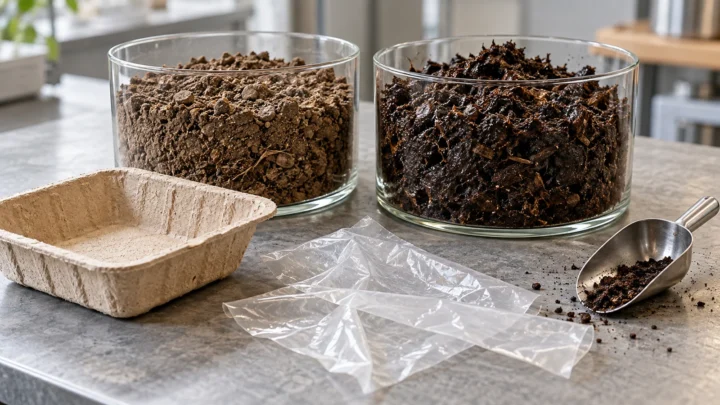
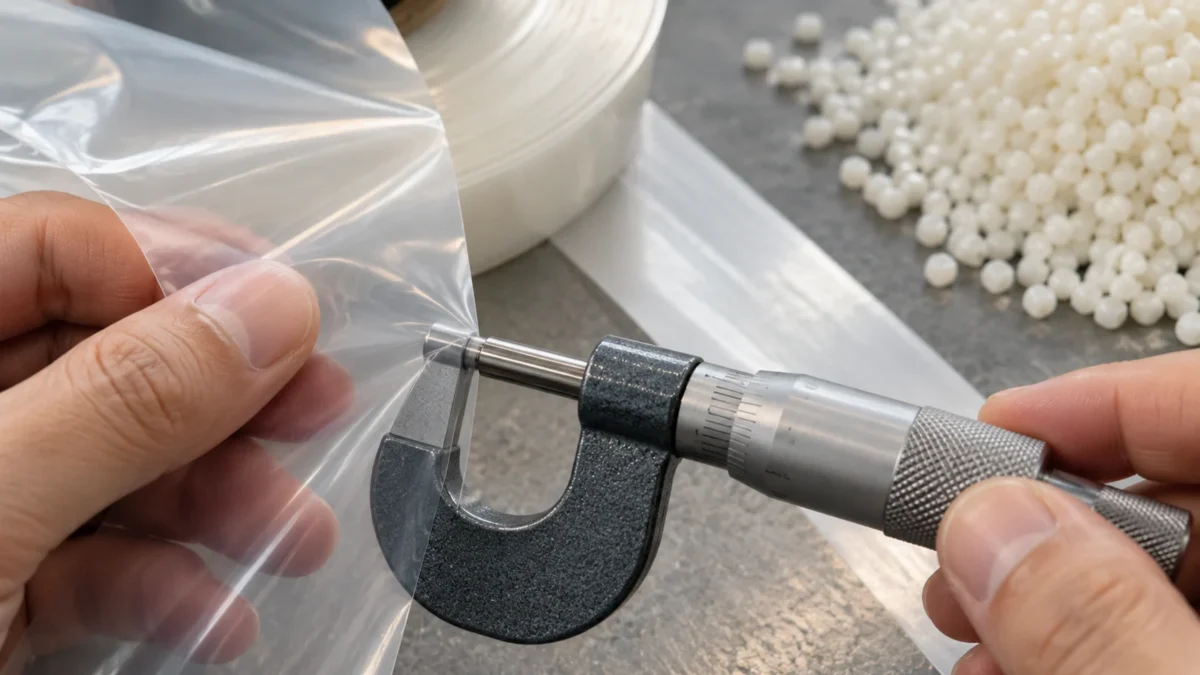
Two packages can carry the same polymer name and still break down at completely different speeds.
For illustration, a thin film may fragment sooner than a thicker article of the same base resin under one method. Crystal structure, fillers, plasticizers and phase interfaces can change access as well. This comparison supplies no universal time or fixed direction for mineralization.
This is why biodegradation time should never be treated as a property printed permanently onto the resin.
The better model is:
polymer chemistry × geometry × morphology × formulation × environment.
This is an editorial comparison of three material variables—thickness, crystallinity and additives—not a new controlled experiment. The cited studies use their own conditions; results are not combined into a single causal ranking.
Geometry and manufacturing
How thickness changes exposure
Thickness is one of the simplest variables to understand and one of the easiest to ignore.
Access mechanisms differ. Water can diffuse into a polymer and drive bulk hydrolysis, while extracellular enzymes often act at accessible surfaces. Thickness changes transport distances and exposed area, but does not by itself prescribe a universal ordering for every degradation endpoint.
A thin film shortens those transport distances.
A thick wall lengthens them.
Bellon and co-workers’2025 review identifies specimen construction, polymer/additive composition and compost conditions as interacting variables. It compares heterogeneous methods; the specific 30 µm-versus 200 µm outcome is not reproduced here without its original experimental record. [S1]
The mechanism is useful without an invented timetable: surface-area-to-volume ratio and diffusion distance can change the observed rate, while the actual specimen and endpoint still determine what a comparison means.
Thin does not automatically mean “more biodegradable”
This distinction matters.
Reducing thickness does not change the chemical identity of a non-biodegradable polymer into a biodegradable one. It changes how quickly a degradable material can interact with its environment.
Likewise, a thick article that degrades slowly is not necessarily made from a non-biodegradable resin.
Geometry changes kinetics, not the fundamental chemistry.
That is why a resin-level biodegradation result should not automatically be transferred to a thick fork, capsule, lid or rigid tray.
Manufacturing can create an “effective thickness” that is not visible on the drawing
Nominal wall thickness is not the only geometry variable.
Surface roughness, internal porosity, printing layers, microcracks and voids can increase the area exposed to water and microorganisms.
A 2026 RSC Sustainability study compared PLA labware produced by 3D printing and injection molding under controlled composting conditions. Both started from commercial PLA, but the manufacturing route changed the surface and internal structure. The 3D-printed specimens disintegrated faster than the injection-molded specimens in the study. [S2]
The authors linked that difference to manufacturing-induced features including surface topography, morphology and material structure. [S2]
This is a useful warning for specification work:
two parts with similar external dimensions can present very different internal access routes to the composting environment.
Crystalline structure and hydrolysis
Crystallinity changes which polymer chains are easiest to attack
Semicrystalline biodegradable polymers contain more ordered crystalline regions and less ordered amorphous regions.
Those regions do not behave identically during degradation.
Amorphous chains generally have greater mobility and looser packing. Water and enzymes can often access them more readily. Crystalline regions are more densely packed and can be less accessible.
The 2026 review by Ashoor and colleagues emphasizes that PLA, PBAT and PBS degradation depends not only on hydrolysable ester bonds but also on crystallinity-related structure, polymer morphology, temperature and exposure conditions. [S4]
This means “same polymer” can still contain different fractions of readily accessible material.
Early degradation can make the remaining polymer look more crystalline
This can produce an apparently paradoxical result.
During early degradation, amorphous regions may hydrolyze or erode preferentially. The residual specimen can therefore become enriched in crystalline material.
Crystallinity can change during degradation through preferential loss of less ordered material and through reorganization of the remaining chains. It is not a fixed datasheet input throughout an exposure.
So crystallinity is not merely an initial datasheet value. It can change during the degradation process itself.
Why crystal fraction alone is insufficient
Crystal fraction matters, but so do:
- crystal type;
- crystal size;
- lamellar structure;
- orientation;
- molecular weight;
- surface morphology;
- temperature relative to Tg and Tm;
- hydrolysis history.
A separate controlled PLA hydrolysis study at 70 °C and 95% relative humidity found that initially amorphous and annealed specimens could develop similar crystallinity while showing different molecular-weight loss. This is accelerated hydrolysis, not a compostability test, but it shows why initial crystal fraction alone is insufficient. [S11]
That does not overturn the role of crystallinity. It shows why one structural variable cannot predict the whole pathway.
Material morphology has to be interpreted together with temperature, hydrolysis and specimen construction.
Processing changes crystallinity before disposal begins
PLA annealing, nucleating agents and cooling history change the initial structure; their heat-performance consequences are explained in the heat-resistant PLA analysis.
Those same processing choices also change the starting point for end-of-life degradation.
A rapidly cooled amorphous PLA film and an annealed heat-resistant PLA article may have:
- different crystal fractions;
- different molecular orientation;
- different internal stress;
- different surface morphology;
- different water uptake and hydrolysis kinetics.
This is why a compostability claim attached only to the polymer family name is incomplete.
Formulation changes more than one variable
Additives can accelerate, delay or redirect breakdown
“Additive” is too broad to have one effect.
A formulation may contain:
- plasticizers;
- mineral fillers;
- starch or natural fibers;
- nucleating agents;
- compatibilizers;
- chain extenders;
- pigments;
- antioxidants;
- antimicrobial compounds;
- processing aids.
Each can change degradation through a different mechanism.
A plasticizer can increase mobility—and sometimes accelerate degradation
Plasticizers generally increase chain mobility and lower stiffness or glass-transition behavior.
Plasticization can change chain mobility, moisture response and physical loss during exposure. That mechanistic possibility is not enough to predict the compostability of a particular plasticizer/PLA formulation.
When an experiment measures mass loss, leached additive or unrecovered fragments may contribute. Carbon mineralization must be established by an appropriate separate endpoint.
For the related distinction, see what compostability tests actually measure.
The defensible conclusion is therefore:
plasticization can alter the physical and hydrolytic accessibility of PLA and may accelerate degradation-related mass loss under specific conditions.
It is not evidence that every plasticizer makes every PLA package “more compostable.”
Natural fillers can open pathways—but they can also change crystallinity
Hydrophilic natural fillers can absorb water and provide preferential routes into a polymer matrix. If microorganisms consume the filler first, pores and cracks can develop, increasing access to the surrounding polymer.
The 2025 home-composting review identifies this mechanism as one reason natural fillers sometimes accelerate degradation.
But fillers can also act as nucleating agents and increase polymer crystallinity.
A 2025 PLA/pounamu study compared compression-molded and 3D-printed specimens during 12 months in room-temperature compost, primarily by residual mass. Its molding-route and filler effects are evidence about that specimen system, not a complete carbon-mineralization result. [S6]
So the correct statement is not “natural fillers accelerate biodegradation.”
It is:
fillers alter water uptake, morphology, crystallinity and surface access; the net degradation effect depends on which influence dominates.
Compatibilizers can make a package stronger and simultaneously change end-of-life access
Compatibilizers are used to improve adhesion between otherwise poorly compatible phases such as TPS and PBAT or PLA and another polyester.
Better interfacial adhesion can improve tensile performance and processing stability.
But a tighter interface can also change:
- water penetration;
- interfacial voids;
- surface erosion;
- phase accessibility;
- fragmentation behavior.
In the previously examined PBAT/TPS study, compatibilization improved adhesion while reducing the reported degradation rate in that tested system. The TPS blend analysis preserves that distinction.
This is why additives should never be evaluated only during use-phase testing.
Nucleating agents change the initial morphology
Nucleating agents are especially relevant to PLA.
They are added to accelerate crystallization so that the finished article can develop heat resistance within a practical molding cycle.
That can increase the fraction or alter the morphology of ordered regions before the package ever reaches compost.
The same formulation decision that improves heat stability can therefore change the accessibility of the polymer during hydrolysis and biodegradation.
This does not mean a nucleated PLA package is non-compostable. It means the finished formulation must be assessed as its own article.

Thickness, crystallinity and additives interact rather than act independently
A useful mental model is not three separate sliders.
It is a network.
| Change | Possible effect | Counter-effect to check |
|---|---|---|
| Reduce thickness | Shorter diffusion distance; higher surface-area-to-volume ratio | Higher crystallinity or hydrophobic coating may still slow access |
| Increase crystallinity | Less accessible ordered fraction; improved heat stability | Processing may also create cracks, orientation or new surface area |
| Add hydrophilic filler | More water uptake, porosity and microbial access | Filler may also nucleate crystallization |
| Add plasticizer | More chain mobility and lower Tg | Plasticizer may leach, migrate or change morphology |
| Add compatibilizer | Stronger interface and better processing | Fewer interfacial pathways can change degradation kinetics |
Source basis: [S2] [S4] [S6] [S11]. This table is an editorial comparison, not a product qualification or statutory checklist.
That interaction explains why additive studies sometimes appear contradictory.
They are often changing more than one variable at once.
Evidence and scope: [S1] [S4] [S6]. Comparative tables in this section are editorial synthesis, not a new test.
Why degradation studies should report more than polymer name and temperature
| Field | Why it matters |
|---|---|
| Exact polymer / blend | Base chemistry controls hydrolysis and enzyme susceptibility |
| Thickness and dimensions | Set diffusion distance and surface-area-to-volume ratio |
| Manufacturing method | Changes porosity, orientation, surface and molecular history |
| Initial crystallinity | Changes accessible amorphous fraction |
| Molecular weight | Lower-molecular-weight chains generally reach microbial-accessible sizes sooner |
| Additive package | Can change water uptake, microbes, crystallization and interfaces |
| Conditioning / aging | Can change moisture and morphology before testing |
| Environment / temperature | Controls hydrolysis and biological activity |
| Endpoint | Mass loss, disintegration and CO₂ mineralization are not equivalent |
| Duration | Kinetics cannot be interpreted without time |
Source basis: [S2] [S4]. This table is an editorial comparison, not a product qualification or statutory checklist.
Do not build a universal degradation-time chart
A table saying “PLA = X months, PBAT = Y months, PHA = Z months” is usually misleading.
The 2026 condition-dependent review of PBAT, PLA and PBS explicitly emphasizes that degradation efficiency varies with polymer structure, microbial strain, enzyme activity, temperature, medium composition and exposure conditions. [S4]
Thickness, crystallinity and additives add another layer of variability inside the material itself.
A useful degradation result therefore belongs to a specimen and method—not to a polymer name in isolation.
What the evidence changes
Qualify the complete formulation at its actual thickness and manufacturing history. Report morphology, exposure and endpoint together; neither a resin name nor one additive effect supplies a universal breakdown time.
Methodology and editorial note
This technical explainer synthesises the identified official guidance, public standard scopes and research records. Study findings remain specific to their reported materials and conditions. Sources checked 19 October 2026; no product testing, factory inspection or independent certification assessment was performed for this article.
The main image is an AI-generated editorial illustration of an unnamed conceptual scene. The explanatory figure is an original editorial synthesis, not a photograph of an experiment, microscopic structure or measured result.
Official sources and reference notes
- [S1] Jules Bellon et al. Challenges and opportunities in home-composting of biodegradable plastics: A comprehensive review. Results in Engineering 28 (December 2025), 107535. Original review abstract/highlights: heterogeneous specimen, additives and compost conditions. Official indexed abstract/relevant public sections checked; detailed 30/200µm comparison not reproduced. Accessed 19 October 2026.
- [S2] Jennie O’Loughlin et al. Manufacturing process significantly impacts the rate of degradation of polylactic acid (PLA) under controlled composting conditions. RSC Sustainability 4(2026),813–828; first online 11 November 2025. Abstract; manufactured specimens and composting methods; surface-topography results; Conclusion. Full relevant official publisher sections checked; disintegration is distinguished from mineralization. Accessed 19 October 2026.
- [S4] Selim Ashoor et al. Condition-dependent microbial and enzymatic degradation of PBAT, PLA, and PBS. Applied Biological Chemistry 69, Article 44; published 22 July 2026. Condition-dependent degradation and polymer-structure discussion. Relevant full public review checked; no cross-polymer rate ranking. Accessed 19 October 2026.
- [S6] Authors as listed in Polymers. Enhancing Biodegradation of Poly(lactic acid) in Compost at Room Temperature by Compounding Jade Particles. Polymers 17(15), 2037; published 26 July 2025. Methods; residual mass and crystallinity;12-month conclusions. Full relevant original study checked. Primarily residual-mass assessment; not a carbon balance. Accessed 19 October 2026.
- [S11] Yutaka Kobayashi et al. Changes in Crystal Structure and Accelerated Hydrolytic Degradation of Polylactic Acid in High Humidity. Polymers 13(24),4324;10 December 2021;DOI10.3390/polym 13244324. 70°C/95%RH; molecular weight and crystallinity comparison. Retained full relevant original-study sections re-read; accelerated hydrolysis, not compost mineralization. Accessed 19 October 2026.
The public corrections channel is currently inactive. Read our corrections policy.