
Three market-research firms can publish three different answers to the same question: How big is the sustainable packaging market?
For 2026, Mordor Intelligence estimates the global market at USD 325.94 billion. Grand View Research estimates USD 326.7 billion. Fortune Business Insights puts it at USD 399.97 billion. [S6] [S7] [S8]
The highest of those estimates is about 23% above the lowest.
That spread does not automatically mean one estimate is wrong. It means the phrase sustainable packaging market is not a single official statistical category with one globally observed total.
Before trusting any market-size number, the first question should be:
What exactly is inside the denominator?
Data audit 1 — “sustainable packaging” is a framework before it is a market segment
The Sustainable Packaging Coalition’s Materials Matrix evaluates sourcing impacts, recoverability, recycled content, performance and other considerations across materials. Its systems perspective matters here: a material name alone does not qualify every package as sustainable. [S1]
That creates a measurement problem.
A recycled-content PET bottle can be counted as sustainable under one model. So can a refillable glass bottle, a recyclable corrugated box, a compostable bagasse tray or a reusable transport crate. Those products do not belong to one manufacturing industry, one customs code or one recovery route.
They can also overlap.
A package may be:
- recyclable;
- made with recycled content;
- lightweighted;
- reusable;
- made partly from renewable feedstock;
- covered by a recovery program.
If a market model simply adds each sustainability category independently, the same packaging revenue can be counted more than once.
So a credible market estimate needs a qualification rule: which packages count, which do not, and how overlapping attributes are handled.
Data audit 2 — official statistics usually classify packaging by material, industry or waste stream, not by “sustainability”
Official datasets are extremely useful, but they answer narrower questions.
Eurostat’s packaging-waste system classifies packaging waste into paper and cardboard, plastic, glass, wood, metal and other materials. Its current dataset covers packaging waste generated and treated, not global packaging sales. [S2]
The U.S. Census Bureau uses manufacturing classifications such as paperboard container manufacturing, plastics packaging film and sheet manufacturing, plastics bottle manufacturing and other plastics product manufacturing. Its Annual Integrated Economic Survey reports measures such as sales, value of shipments or revenue for industries. [S3] [S10]
UN Comtrade organizes international merchandise trade by commodity classifications such as the Harmonized System, SITC and BEC. [S4]
None of those systems creates a ready-made line called “global sustainable packaging revenue.”
The practical consequence is important:
a sustainable-packaging market total is normally constructed from several datasets and a set of modeling assumptions.
What the 2026 commercial estimates actually show
| Source | Published 2026 estimate | Visible scope / methodology signal | How to read it |
|---|---|---|---|
| Mordor Intelligence [S6] | USD 325.94 billion | Recyclable, reusable, compostable/biodegradable, recycled-content and edible packaging across multiple materials; proprietary estimation framework. 2026–2031 forecast window; 2025 base | Commercial modeled market value |
| Grand View Research [S7] | USD 326.7 billion | Materials, packaging type, format, process, application and region; reports revenue and volume forecasts. 2024–2030 study window; 2023 base | Commercial modeled market value |
| Fortune Business Insights [S8] | USD 399.97 billion | Paper/paperboard, glass, plastic, metal and other materials across multiple package types and applications. 2026–2034 forecast window; 2025 base | Commercial modeled market value |
Global value estimates in USD billions, as visible at the 19 October 2026 cutoff. The spread is 399.97 − 325.94 = 74.03; 74.03 ÷ 325.94 = 22.71%, rounded to 23%. This compares published estimates, not comparable model populations or independent error bounds.
These figures are useful as analyst estimates. They are not interchangeable with an official production statistic.
The roughly USD 74 billion difference between the highest and lowest 2026 estimates is therefore a warning against false precision. Reporting the market as “USD 399.97 billion” without the source definition implies a level of certainty that the category itself does not support.
Data audit 3 — revenue is not physical demand
Market value is usually expressed in currency. Physical demand is expressed in units such as tonnes, square metres, bottles, trays, cartons or packages.
Those two measures can move differently.
Revenue can rise because:
- more packaging is sold;
- the product mix shifts toward higher-value formats;
- raw-material prices rise;
- energy or freight costs increase;
- currency movements change reported dollar values;
- more converting or service value is included in the measured boundary.
A 7% increase in market revenue therefore does not prove a 7% increase in physical packaging consumption.
For demand analysis, value and volume should be reported separately whenever both are available.
For example, revenue growth of 7% alongside a 10% rise in like-for-like unit prices would imply about 2.7% fewer units: 1.07 ÷ 1.10 − 1. This is a hypothetical fixed-mix calculation, not a finding about the 2026 market. Currency translation or a changing product mix would require a further bridge.
Data audit 4 — shipments, production and consumption are different measures
A manufacturer’s shipments tell you what left its facilities. Production tells you what was made. Domestic consumption additionally depends on trade and inventory movements.
A common analytical approximation is:
apparent consumption ≈ domestic production + imports − exports.
That can be useful, but it is still an approximation. Re-exports, inventory changes, product classification and valuation differences can matter.
Trade data also have their own valuation rules. International merchandise statistics may report import and export values on different bases depending on the reporting system. A customs value is not automatically comparable with a converter’s net sales or a retailer’s packaging spend. [S4]
Market analysis becomes unreliable when these different concepts are merged into one chart without explanation.
Data audit 5 — waste generation is a physical signal, not a market-revenue number
Waste statistics can provide a useful reality check because packaging eventually enters a recovery or disposal system.
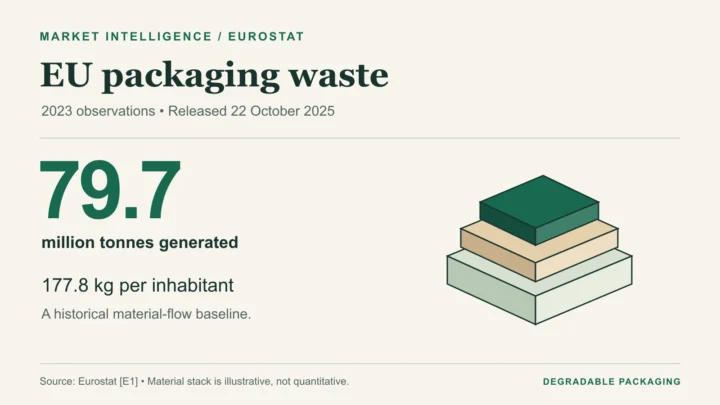
Eurostat reported that the EU generated 79.7 million tonnes of packaging waste in 2023, equal to 177.8 kg per inhabitant. Paper and cardboard represented 40.4% of that waste by mass; plastic represented 19.8%. [S2]
Those numbers tell us something about material throughput and the composition of the waste stream.
They do not tell us that the EU packaging market was worth a particular number of euros.
Waste tonnes are affected by package weight. A lightweight flexible plastic package can represent little mass but large unit volume or product value. Glass can contribute substantial mass with fewer units. Reuse systems may deliver packaging service without generating a new package on every use cycle.
This is why waste volume should not be used as a direct proxy for market revenue.
Data audit 6 — “paper share” is not automatically “sustainable share”
Material identity and sustainability qualification are different questions.
Paper can be renewable, recyclable and widely recovered in suitable systems. It can also contain coatings, laminates or food contamination that affect recovery. Plastic can be virgin, recycled-content, recyclable, reusable, compostable or none of those, depending on the construction and system.
A market report that includes paper, plastic, glass and metal inside a sustainable-packaging model therefore needs another filter beyond material name.
Otherwise the model risks measuring a large part of the conventional packaging market and relabeling it as sustainable.
The key question is:
What sustainability criterion had to be met for the package revenue to enter the model?
Data audit 7 — a narrow application can change the answer by hundreds of billions of dollars
Scope can change the market total more than growth itself.
Grand View Research, for example, estimates its broad global sustainable-packaging market at USD 326.7 billion for 2026, while its separate sustainable-packaging-for-food market estimate is USD 82.3 billion for 2026. [S7] [S9]
That does not indicate contradiction.
The second study has a narrower food-application boundary and a different base/forecast vintage. It should not be divided by the broad estimate to calculate a verified food-market share.
A market figure should therefore always state whether it covers:
- all end-use industries;
- food and beverage only;
- consumer packaging only;
- primary packaging;
- secondary and tertiary packaging;
- industrial transport packaging;
- packaging materials only;
- finished converted packaging.
A market-size number without that boundary is incomplete.
Data audit 8 — forecasts are scenarios, not observations
A forecast combines a baseline with assumptions.
Those assumptions may include:
- regulation;
- consumer demand;
- brand commitments;
- material substitution;
- price premiums;
- new capacity;
- recycling infrastructure;
- technology adoption.
Mordor identifies a proprietary estimation framework. Grand View and Fortune publish market boundaries and base/forecast periods in their public summaries. We examined those summaries, not the paid models or their complete deduplication methods. [S6] [S7] [S8]
That information is useful because it tells readers they are looking at modeled intelligence, not an audited global sales ledger.
The correct wording is:
“Firm X estimates…”
not:
“The sustainable packaging market is exactly…”
Observed data and forecast data belong in different columns
| Metric | What it measures | Best evidence source | Common misuse |
|---|---|---|---|
| Production | Goods made in a defined industry/geography | Official manufacturing statistics | Called “demand” without trade adjustment |
| Shipments / sales | Output sold or shipped by reporting firms | Official industry data / audited company reports | Added across supply-chain stages, causing double counting |
| Imports / exports | Cross-border commodity flows | Customs / UN Comtrade | Treated as domestic consumption |
| Waste generation | Packaging entering waste systems by mass | Official waste statistics | Converted directly into market revenue |
| Buyer survey | Reported intentions or preferences | Transparent survey with methodology | Treated as actual purchasing |
| Market estimate | Modeled value based on a defined market boundary | Research provider with visible scope/method | Presented as an official observed total |
| Forecast | Modeled future scenario | Transparent forecast methodology | Presented as a future fact |
Editorial classification of evidence types, not a new market dataset. [S2] [S3] [S4]
The denominator problem gets harder when categories overlap
Suppose a refillable PET bottle contains recycled resin and is technically recyclable.
Should it be counted under:
- reusable packaging;
- recycled-content packaging;
- recyclable packaging;
- sustainable plastic packaging;
- all four?
For market sizing, the correct answer depends on the model.
A process-share chart may legitimately classify the bottle by one dominant pathway. A revenue model may assign it once and tag several attributes. A badly constructed model may count the same revenue repeatedly.
This is why segmentation totals should be checked against the parent market and why overlapping sustainability attributes should not automatically be summed.

A better way to measure sustainable-packaging demand
Instead of looking for one magic global number, build a dashboard.
For a specific packaging category or region, track at least five dimensions:
- Physical demand: tonnes, units or square metres consumed.
- Market value: revenue or spend, with price basis and currency.
- Sustainable qualification: the exact rule for recycled content, reuse, recyclability, compostability or another attribute.
- Adoption: share of purchases, shipments or SKUs that meet the rule.
- Recovery reality: whether the package is actually collected, recycled, reused or composted at meaningful scale.
The dashboard separates purchasing activity from the attributes and recovery system that qualify it. A rise in one column need not imply a rise in the others.
How to use the estimate range without turning it into a consensus
A range can describe the estimates reviewed here, provided it is not presented as a statistical confidence interval or a consensus forecast.
As of the 19 October 2026 source cutoff, several commercial research providers place the broad 2026 global sustainable-packaging market in roughly the USD 326–400 billion range. [S6] [S7] [S8]
That should be described as a range of proprietary market estimates, not as one observed official total.
Before using any one of these estimates, check:
- which definition each provider uses;
- whether the number is observed, estimated or forecast;
- which materials and end uses are included;
- whether the study reports value, volume or both;
- which official datasets can be used to test the direction of the estimate.
For a buyer, supplier or investor, that context is more valuable than another decimal place.
See the April–October 2026 demand-signal review for how these distinctions change the reading of current shipment and buyer data.
The market-measurement conclusion
There is a large global market for packaging designed around recycled content, recyclability, reuse, renewable materials, compostability and other sustainability strategies.
But “the sustainable packaging market” is a constructed analytical category, not a single globally observed statistical line.
Official systems measure pieces of the picture: production, shipments, trade, waste and recycling. Commercial market researchers combine those signals with their own category definitions, prices, interviews and forecasts.
That is why credible market intelligence should never start with the CAGR.
It should start with the denominator.
Before asking how fast sustainable packaging is growing, define what counts as sustainable packaging, what unit is being measured, which geography and period apply, and whether the number is observed or modeled.
Methodology and editorial note
This data audit compares visible provider summaries with official statistical definitions. Paid models, underlying interview data and deduplication methods were not independently audited. Calculations of the estimate spread and the hypothetical price/volume bridge are original arithmetic, not a consensus forecast. Sources checked 19 October 2026. No supplier audit, factory inspection or independent market census was performed for this article.
The main image is an AI-generated editorial illustration of a generic industry scene, not a named company, product or real event. The in-body figure is an original source-grounded synthesis or labelled calculation.
Official sources and reference notes
- [S1] Sustainable Packaging Coalition. Materials Matrix. Public matrix checked 19 October 2026. Introduction and eight areas of consideration; recoverability, performance and recycled content. Relevant public matrix checked via web reader; companion PDF not retrieved. Accessed 19 October 2026.
- [S2] Eurostat. Packaging waste statistics. Data extracted 10 October 2025; observation year 2023. Highlights; Waste generation by packaging material; underlying env_waspac dataset. Full relevant public summary checked. These are waste-mass statistics, not packaging market revenue. Accessed 19 October 2026.
- [S3] U.S. Census Bureau. 2024 Annual Integrated Economic Survey Data. 2024 observations; tables released September 2026. AIES00NONEMP sales/value of shipments/revenue and AIES31BASIC manufacturing table descriptions. Relevant official table descriptions checked; no numerical Census estimate is asserted. Accessed 19 October 2026.
- [S4] UN Statistics Division. International Merchandise Trade Statistics. Public methodology resources checked 19 October 2026. Commodity classification and trade valuation resources. Public methodology checked; no trade-flow extraction or numerical market total claimed. Accessed 19 October 2026.
- [S6] Mordor Intelligence. Sustainable Packaging Market. 2026 estimate; forecast 2026–2031. Market Snapshot; estimation-framework note; segmentation. Public commercial summary checked, not paid model or independently validated estimate. Accessed 19 October 2026.
- [S7] Grand View Research. Sustainable Packaging Market (2024–2030). 2023 base; 2026 estimate; 2030 forecast. Summary; Report Scope; segmentation and quantitative units. Public commercial summary checked; full paid model, overlap rules and microdata not audited. Accessed 19 October 2026.
- [S8] Fortune Business Insights. Sustainable Packaging Market Size, Share & Growth Analysis. Page updated 28 September 2026; 2025 base; 2026 estimate; 2034 forecast. Key Market Insights; Report Scope & Segmentation. Public commercial summary checked via web reader; full paid methodology not examined. Accessed 19 October 2026.
- [S9] Grand View Research. Sustainable Packaging For Food Market. 2025 base; 2026 estimate; forecast 2026–2033. Summary and Report Scope. Public commercial summary only. Separate study, not an audited subset of the broad market. Accessed 19 October 2026.
- [S10] U.S. Census Bureau. 2022 NAICS Manual. 2022 classification edition. Paperboard containers, plastics packaging film/sheet and plastic bottles classification descriptions. Relevant official classification descriptions checked; this is a sector taxonomy, not a sustainable-product qualification. Accessed 19 October 2026.
The public corrections channel is currently inactive. Read our corrections policy.