
A PET bottle and a clear food tray can share a resin while facing different collection, sorting and reprocessing conditions. That difference is the useful starting point for the Packaging Data Hub, co-led by Systemiq and Earth Action. Its current public description covers 50 countries and 12 plastic packaging formats, with reference years ranging from 2019 to 2025 depending on the country. The platform separates packaging placed on the market, collected for recycling and recycled in practice. [1]
Our assessment is that the Hub’s immediate value lies in helping packaging teams locate the next question to investigate. A country-level comparison can reveal where a format appears to lose material. Turning that signal into a specification change or infrastructure investment still requires evidence from the operators handling the actual pack.
Three measures lead to three different decisions
The Hub provides sources, assumptions and confidence levels alongside its figures. Its public launch interview describes “recycled in practice” as recyclate output, with modeled losses applied where underlying sources measure an earlier processing stage. Readers should therefore check both the stage measured and how much of the final estimate depends on assumptions. [1] [2]
Consider the difference between collecting a container and selling usable recycled material. A collection total does not explain what happens to that container during sorting and processing. Equally, a low final output does not identify a defective pack design by itself. It could point the buyer toward questions about capture, contamination, processing capacity or demand. Those explanations require local evidence.
The following is our proposed way to turn the three measures into an investigation. It is a decision aid, rather than a report of results extracted from the subscription dataset.
| Signal to examine | Evidence to request | Decision it could inform |
|---|---|---|
| Little material reaches collection relative to the amount sold | Program acceptance, collection access and capture information for that format | Whether to prioritise collection access and consumer instructions |
| Collection appears stronger than final recyclate output | Sorting yields, bale specifications, reprocessor acceptance and documented losses | Whether design changes or downstream investment address the bottleneck |
| A reported rate improves between releases | Reference years, source changes, revised assumptions and physical throughput records | Whether to credit an operational gain or update the estimate |
Start with the bottle and the food tray
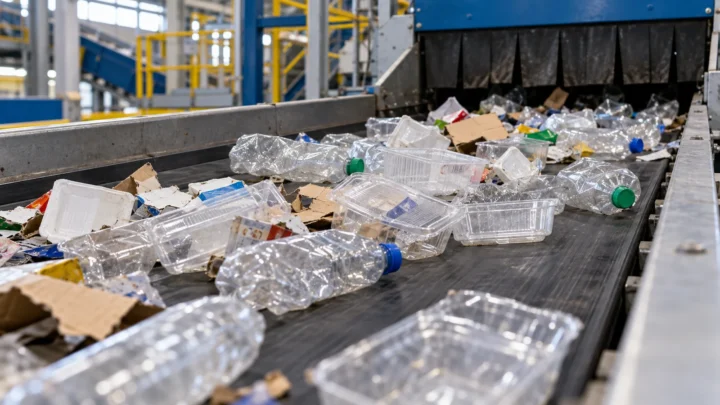
The photograph accompanying this article shows real transparent produce punnets. It illustrates the kind of physical packaging a portfolio review needs to distinguish from a bottle; it is an archival photograph, not a photograph of the Hub or evidence of a particular recycling outcome.
The Recycling Partnership’s PET Recycling Coalition provides a relevant US example. Its work on thermoformed PET identifies reclaimer capability and capacity, end-market demand, design and collection among the issues requiring attention. That supports treating bottles and thermoforms as separate questions rather than assuming that a common resin gives them identical routes. It does not establish the performance of the packs in our photograph or supply a result from the Hub. [3]
For a retailer using clear produce trays, a useful first question is which facilities receive those trays from its principal sales region. The next is whether the receiving facility captures them into a marketable stream, and who buys that stream. Asking only whether the tray carries a PET identification code leaves those operational questions unanswered.
A bottle supplier should make the same distinction when proposing an alternative format. If the commercial pitch relies on the recycling performance of PET bottles, ask whether the cited evidence actually covers the proposed tray, lid and label construction. A material comparison becomes more informative when it follows the finished packaging through the system that will receive it.
Build a comparison that survives a procurement meeting
Begin with two significant formats in one sales market. Record the packs used, annual purchasing volumes and the markets where they are discarded. Keep the reference year, measurement stage and confidence assessment beside each recycling estimate. If one figure describes collection and another describes recyclate output, keep them in separate columns.
Next, identify the business decision. A design team may be deciding whether to change a label, a procurement team may be comparing suppliers, and a retailer may be considering funding for collection. Each needs a different follow-up. The shared dataset can organise the discussion, while the question determines which additional evidence is worth obtaining.
Where a conclusion rests on a modeled loss, ask how sensitive the choice is to that assumption. If a plausible revision would reverse the preferred option, delay an expensive commitment until a facility or reprocessor can clarify the point. If the same bottleneck remains under different assumptions, the team has a stronger reason to investigate it first. This is a proposed decision method, not a sensitivity analysis we have performed on the Hub.
What the industry could gain
For brands operating across markets, consistent definitions could reduce repeated arguments about which recycling rate to use. For converters, format-level comparisons could make customer requests more specific: a buyer can ask about the pack feature relevant to a documented loss instead of requesting a broad “more recyclable” redesign. For collection and processing operators, the same questions could help explain why an investment proposal needs more than a national headline rate.
The commercial opportunity is conditional. If users retain the sources and assumptions when sharing a result, a common dataset may improve coordination. If they export only a single percentage, the old ambiguity can survive inside a more polished presentation. A supplier should expect to explain both the figure and its relevance to the pack being offered.
Keep the platform’s current limits visible
The current scope is plastic packaging. Paper and cardboard, additional end-of-life pathways and US state-level detail are listed among planned 2027 additions. Commercial access to the full platform is subscription-based. We reviewed the public scope and developer explanation; we have not audited the complete dataset or tested its underlying models. [1]
Our view is that the strongest first deliverable is a short, traceable investigation of one format in one market. It should name the suspected bottleneck, the operator who can verify it and the purchasing or investment decision that would change if the evidence holds. That gives the new data a practical job before anyone uses it to justify a portfolio-wide material switch.
Sources
Found an error? Read our corrections policy and contact the editors.