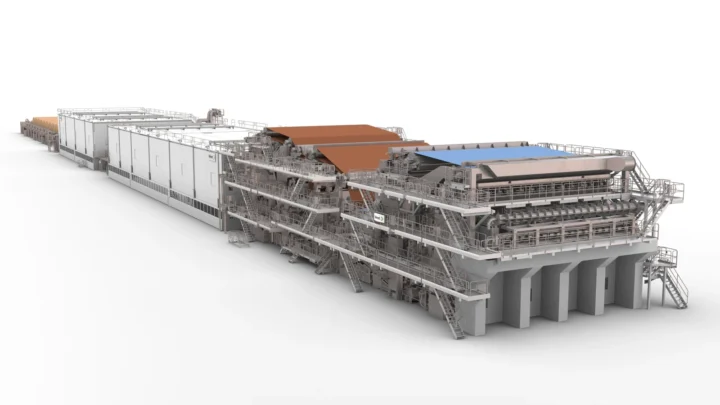
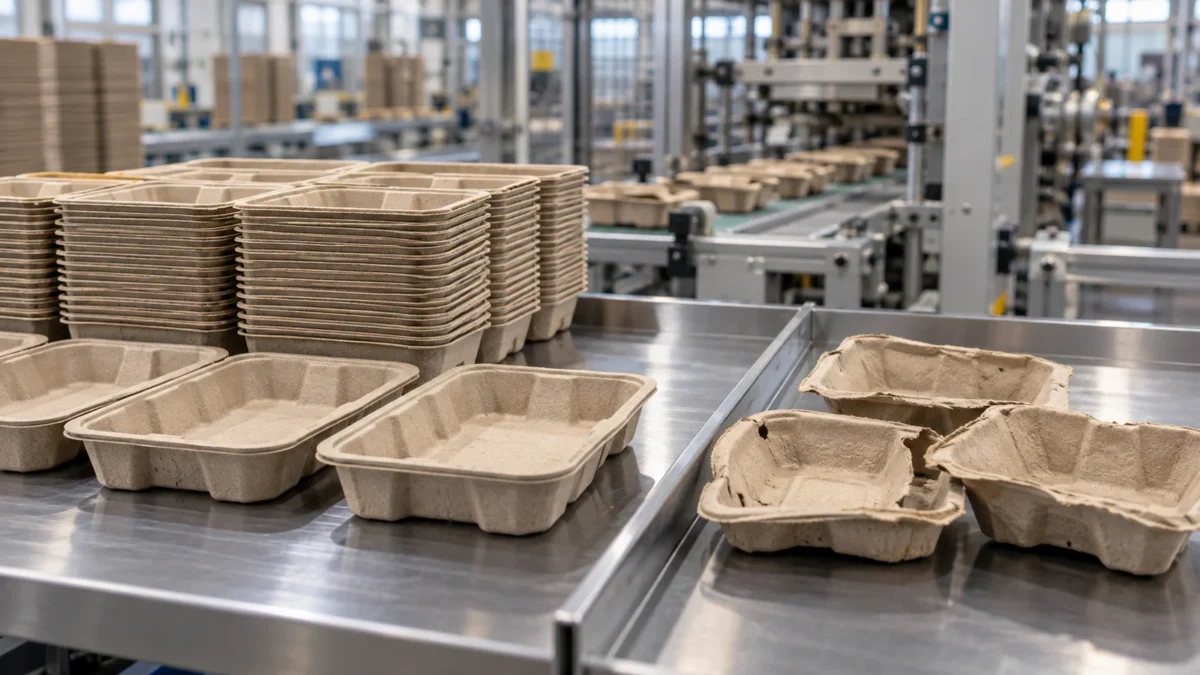
A packaging headline says a new plant will add 100,000 tonnes of annual capacity.
That does not mean the market just gained 100,000 tonnes of sellable packaging.
The project may still need financing, permits, construction, equipment installation, commissioning, customer qualification and a production ramp. Even after the line is mechanically complete, its effective output can remain well below the headline number.
This is the central rule for reading packaging capacity:
announced capacity ≠ installed capacity ≠ commissioned capacity ≠ effective output ≠ sold output.
Capacity is not one number. It is a chain of increasingly demanding claims.
Capacity due diligence starts with one question: what stage is the asset actually in?
A useful capacity ladder is:
- Announced — management or a project sponsor says it intends to build or expand.
- Financed / approved — capital has been authorized or external financing is in place.
- Permitted — required project or environmental approvals have been obtained where applicable.
- Under construction — civil work, machinery installation or conversion is physically underway.
- Mechanically complete / installed — the equipment exists and installation is substantially complete.
- Commissioning — the line is being tested with utilities, material and process controls.
- Commercial startup — saleable production has begun.
- Customer qualified — the relevant grade/package has passed the customer’s technical and compliance requirements.
- Ramped — throughput, yield and operating stability are approaching planned levels.
- Effective output — sustainable production under real operating conditions.
- Sold output — production is actually absorbed by customers.
A press release can legitimately describe a project at stage 1.
A market-supply model should not count it as stage 10.
“Capacity” in official statistics is closer to sustainable output than a headline engineering maximum
The U.S. Federal Reserve defines industrial capacity around the idea of sustainable maximum output: the greatest output a plant can maintain under a realistic operating schedule, allowing for normal downtime and assuming the inputs required to run installed capital are available. [S1]
The U.S. Census Bureau uses a similar practical concept in its plant-capacity survey. It defines full production capacity as the maximum production an establishment could reasonably expect under normal and realistic operating conditions while fully using the machinery and equipment in place. [S2]
Those definitions are useful for packaging market analysis because they reject an important shortcut:
a machine’s theoretical peak rate is not automatically the plant’s sustainable commercial capacity.
Nameplate capacity — useful, but only if the nameplate basis is understood
“Nameplate capacity” is commonly used for the rated output of a line, machine or plant under specified design assumptions.
It is a valuable engineering reference.
But the label can hide several questions:
- Is the figure tonnes of resin, tonnes of paperboard or tonnes of finished packaging?
- Does it assume 24/7 operation?
- How many planned maintenance days are excluded?
- Which product grade is assumed?
- What basis weight, thickness or package weight is assumed?
- Does the rated speed apply to every SKU?
- Does it assume perfect yield?
For packaging, grade mix can change output dramatically.
A line producing one thin, high-speed SKU can generate more units—or different tonnes—than the same line running heavier products, multiple sizes, color changes or high-barrier constructions.
Tonnes are not always the best way to compare packaging capacity
Packaging capacity can be reported in:
- tonnes per year;
- short tons per year;
- pounds per year;
- square metres;
- billion units;
- machine hours;
- cases;
- finished packages.
Those units answer different questions.
A lightweighting project can produce more packages from the same tonnes of material. A heavier high-barrier tray can produce fewer units from the same tonnage. A resin plant’s tonnes are upstream material capacity, not finished-package capacity.
So a statement such as “100,000 tonnes of new packaging capacity” should first identify what exactly is being counted.
Installed does not mean ramped: a 2026 paper-machine example
International Paper disclosed in its second-quarter 2026 filing that it had completed the conversion of its No. 16 paper machine at Riverdale in Alabama from uncoated freesheet paper to containerboard.
The physical conversion was complete.
But the company also said the machine would continue ramping during the remainder of 2026 and was expected to reach full operating capacity in the first quarter of 2027. [S4]
This is a clean example of the capacity ladder:
completed conversion → production ramp → full operating capacity.
If an analyst had counted the full converted capacity on the day construction finished, near-term market supply would have been overstated.
Commissioning is a production stage, not a ceremonial opening date
During commissioning, a new packaging or materials line may need to establish:
- stable machine speed;
- temperature and pressure windows;
- dimensional control;
- coating uniformity;
- drying conditions;
- scrap handling;
- automation logic;
- quality-control limits;
- operator routines.
Early runs may be sellable, partially sellable or non-commercial.
A line can therefore be “operating” before it is producing at its economic design rate.
Ramp-up can be limited by yield, not only machine speed
Suppose a line is capable of producing 10,000 pieces per hour.
If 8% of output is rejected during early ramp, the sellable output is not 10,000 pieces per hour.
Hypothetical illustration:10,000 units/hour ×2,000 scheduled hours ×90% availability ×80% running-speed factor ×92% first-pass yield =13,248,000 good units. With60% relevant-grade share and75% qualification share,5,961,600 units remain. These are assumptions, not an observed plant or an industry benchmark.
If frequent grade changes reduce available runtime, the annual number falls again.
A simple model is:
good units = rated units/hour × scheduled hours × availability × running-speed factor × first-pass yield.
That is still simplified. Product mix, scheduled maintenance, raw-material constraints and customer qualification can lower effective commercial output further.
Capacity utilization shows why installed capacity should not be treated as actual output
Current Federal Reserve data make the distinction visible at industry scale.
In September 2026, U.S. paper manufacturing capacity utilization was about 77.3%. Plastics and rubber products were at about 74.6%.
These are broad industry aggregates, not packaging-only utilization rates. [S3]
But they demonstrate the principle:
industries normally operate below 100% of measured sustainable capacity.
Therefore an industry with 1 million tonnes of capacity does not necessarily produce 1 million tonnes in a year.
Utilization can change because of:
- demand;
- maintenance;
- raw-material availability;
- labor;
- energy;
- commercial downtime;
- grade changeovers;
- economic curtailments.
Customer qualification can be the bottleneck after production works
Packaging materials often need more than mechanical production capability.
Customers may need to validate:
- food-contact documentation;
- migration requirements;
- color and odor;
- sealing behavior;
- forming conditions;
- printability;
- barrier performance;
- drop or compression performance;
- recycled-content claims;
- compostability or recyclability claims;
- production consistency.
This can create a gap between technical production and commercially qualified production.
A 2026 SEC-filed investor presentation from PureCycle showed that different recycled-polypropylene grades/applications from the same commercialization program were simultaneously in different states: some were in commercial shipping, some in customer trials or qualification, some in sales, and others scheduled for later commercial production. [S5]
The lesson is broader than one company:
plant capability does not mean every application has cleared the customer-qualification gate.
Food-contact capacity can be smaller than total material capacity
This distinction matters for sustainable packaging because one material facility may serve:
- industrial applications;
- durable goods;
- non-food packaging;
- secondary packaging;
- food-contact packaging.
If a buyer needs a food-contact grade, total plant tonnage is not the relevant denominator.
The relevant question is:
How much qualified capacity can consistently produce the required grade under the required compliance conditions?
Grade mix can make “available capacity” smaller than installed capacity
A mill or polymer plant rarely dedicates every tonne to one packaging application.
Capacity can be consumed by:
- different resin grades;
- different paperboard basis weights;
- export customers;
- internal converting operations;
- non-packaging applications;
- contracted offtake;
- maintenance campaigns.
A plant with 100,000 tonnes of annual nameplate capacity may have only a fraction commercially available to a new food-packaging customer.
“Total capacity” and “open merchant capacity” are different market concepts.
Acquisition is not new industry capacity
This is one of the most common errors in investment trackers.
Packaging Corporation of America completed an acquisition in 2025 that included two containerboard mills with approximately 800,000 tons of production capacity. [S6]
For the acquiring company, capacity increased.
For the industry, those mills already existed.
The transaction changed ownership, not physical industry capacity.
Therefore:
company capacity gained through acquisition ≠ new market capacity.
Closures must be netted against additions
Capacity analysis is also distorted when trackers count openings but ignore shutdowns.
Packaging Corporation of America subsequently completed the shutdown of one paper machine and kraft-pulping facilities at its Wallula mill in the first quarter of 2026 while continuing to operate other equipment at the site. [S6]
Other packaging companies have also closed or converted mills as they invest elsewhere.
The market-relevant equation is:
net capacity change = additions + conversions in − closures − conversions out.
A year with many investment announcements can still produce limited net capacity growth if large older assets close.
A conversion is different from a greenfield addition
When an existing paper machine is converted from one grade to another, capacity is added to one market and removed from another.
The Riverdale example illustrates this clearly: an existing machine was converted from uncoated freesheet to containerboard.
For containerboard, the conversion expands productive capability.
For total paper-industry physical machinery, it is not equivalent to building a completely new machine from zero.
Capacity trackers should label:
- greenfield;
- brownfield expansion;
- debottlenecking;
- grade conversion;
- acquisition;
- restart;
- closure.
Debottlenecking can create real output without a headline new plant
Not all meaningful capacity comes from a new factory.
A producer can increase effective output by improving:
- dryer capacity;
- forming speed;
- extrusion throughput;
- changeover time;
- material handling;
- automation;
- yield;
- maintenance uptime.
That means a market tracker focused only on “new plants” can miss incremental supply from existing assets.
Financing and permits are evidence of progress, not evidence of production
A project that raises capital or receives permits has moved beyond an unsupported concept.
But neither event proves that the plant has been built.
The evidence hierarchy should progress from:
intent → authorization → construction → commissioning → production → qualification → sustained output.
The closer the evidence is to sustained output, the stronger the market-supply claim.
Offtake agreements are useful—but still not identical to sold output
A producer may announce an offtake agreement before a plant starts.
That can reduce commercial risk and provide evidence of customer interest.
But an offtake contract can contain:
- conditions precedent;
- qualification requirements;
- minimum/maximum volumes;
- price formulas;
- startup timing;
- termination provisions.
So “contracted capacity” should be reported separately from delivered volume.
The capacity evidence matrix
| Status | Strong evidence | What can be said | What cannot yet be assumed |
|---|---|---|---|
| Announced | Official project/company disclosure | Company intends to add stated capacity | Capacity will definitely be built |
| Financed / permitted | Financing close, board authorization, official permit | Project has passed a material development gate | Commercial production has begun |
| Under construction | Construction disclosure / permit progress / verified site work | Physical build is underway | Startup date or final output is guaranteed |
| Installed | Mechanical completion / equipment installation | Production assets are physically in place | Stable saleable output |
| Commissioning | Trial operation / startup disclosure | Process is being brought online | Full-rate production |
| Commercial startup | Commercial production / first shipments | Saleable output has begun | Nameplate utilization |
| Customer qualified | Named qualification / approved grade / repeat orders | Specified application has cleared a commercial gate | Every grade/customer is qualified |
| Ramped | Utilization, production, yield or shipment evidence | Output is approaching planned operating levels | 100% nameplate every period |
| Sold output | Shipments / sales / utilization plus demand evidence | Capacity is translating into market supply | Future demand remains guaranteed |
Original editorial evidence ladder, not a statutory project classification. Stage claims depend on the issuer’s dated evidence; qualification applies to the specified grade/customer. [S1] [S2] [S4] [S5] [S6]
How to calculate market-relevant capacity
For market analysis, a more useful model than headline nameplate is:
For a line rated in units per hour: qualified good units ≈ rated units/hour × scheduled hours × availability × running-speed factor × first-pass yield × relevant-grade share × qualification share.
This is a conceptual model, not a universal accounting formula.
Each factor must have a defined denominator and non-overlapping boundary. If a disclosed annual nameplate or official sustainable-capacity number already allows for downtime or yield, do not apply those losses again. Actual output divided by official capacity is a different statistical ratio; it is not an additional mechanical discount.
If the plant has 100,000 tonnes of nameplate capacity but:
- runs below full utilization;
- loses output during ramp;
- allocates only part of production to food packaging;
- has only some grades customer-qualified;
then the immediately relevant supply can be far below 100,000 tonnes.

What should a packaging capacity tracker record?
For every project:
- company;
- site and country;
- material/product;
- project type;
- announcement date;
- stated capacity;
- capacity unit;
- capacity basis;
- current status;
- construction status;
- startup date;
- ramp target;
- qualified applications;
- closures or offsets;
- evidence date;
- confidence level.
Without those fields, “global capacity added” can become little more than the sum of press-release numbers.
Capacity conclusion
A packaging capacity announcement is an important market signal, but it is only the beginning of the evidence chain.
The market does not consume announcements.
It consumes qualified, sellable output.
That output depends on construction, commissioning, stable production, yield, grade mix, customer qualification, utilization and actual demand.
Acquisitions change ownership but may add no industry supply. Conversions add one grade while removing another. Closures can offset new projects. Debottlenecking can add output without a new plant. And even a completed production line can take months to reach full operating capacity.
The correct question is therefore not:
“How much capacity has been announced?”
It is:
“How much qualified, sustainable and commercially absorbed output has actually reached the market?”
Methodology and editorial note
This is an editorial method for assessing capacity claims, informed by official Federal Reserve and Census definitions plus dated company filings. The rated-speed example is hypothetical and its non-overlapping factors are explicit. It is not a plant audit, a packaging-only utilization estimate or a forecast of sold output. Sources checked 19 October 2026. No supplier audit, factory inspection or independent market census was performed for this article.
The main image is an AI-generated editorial illustration of a generic industry scene, not a named company, product or real event. The in-body figure is an original source-grounded synthesis or labelled calculation.
Official sources and reference notes
- [S1] Board of Governors of the Federal Reserve System. Industrial Production and Capacity Utilization — G.17, capacity methodology / annual revision. 16 October 2026. G.17 capacity definition: sustainable maximum output. Original public record; stated measure and scope only. Accessed 19 October 2026.
- [S2] U.S. Census Bureau. U.S. Census Quarterly Survey of Plant Capacity Utilization. Public reference checked 19 October 2026. Full production capacity and actual-production definitions. Original public record; stated measure and scope only. Accessed 19 October 2026.
- [S3] Board of Governors of the Federal Reserve System. Industrial Production and Capacity Utilization — Table 7. 16 October 2026. Table 7; September 2026, NAICS322 and326. Original public record; stated measure and scope only. Accessed 19 October 2026.
- [S4] International Paper. Form 10-Q for quarter ended 30 June 2026. Public reference checked 19 October 2026. MD&A, PS North America; Riverdale No.16 conversion and ramp outlook. Relevant filing passages read through the public web reader; ordinary direct HTTP returned403. Company-reported, not independently audited. Accessed 19 October 2026.
- [S5] PureCycle Technologies. 2026 investor presentation / Exhibit 99.2. Public reference checked 19 October 2026. Slides10–12; distinct commercial/application qualification states. Relevant filing passages read through the public web reader; ordinary direct HTTP returned403. Company-reported, not independently audited. Accessed 19 October 2026.
- [S6] Packaging Corporation of America. Form 10-Q for six months ended 30 June 2026. Public reference checked 19 October 2026. Note1, Basis of Presentation; Greif acquisition and Wallula shutdown. Relevant filing passages read through the public web reader; ordinary direct HTTP returned403. Company-reported, not independently audited. Accessed 19 October 2026.
The public corrections channel is currently inactive. Read our corrections policy.