Packaging Corporation of America reported Q3 2026 corrugated-product shipments up 10.6% year on year, both in total and per shipping day. Its legacy packaging business was down 0.5% on both measures, with equal shipping days in the comparison periods. These are company-reported figures from its 21 October release. [1]
Two scopes, not a contradiction
The release discusses both legacy operations and the acquired Greif business. A total-business rate and a legacy-business rate therefore answer different questions. The former describes the wider reported perimeter; the latter isolates the legacy comparison. Neither is an industry-wide corrugated-demand measure. [1]
The spread is 11.1 percentage points: 10.6 minus negative 0.5. It is not an estimate of the acquired operations’ contribution. A growth rate divides a change by a prior-period base; subtracting rates with different bases does not recover either operation’s shipment volume. An acquisition bridge needs aligned shipment levels and the precise businesses included in both years.
| Reported scope | Year-on-year change | What a buyer still needs |
|---|---|---|
| Total corrugated products | +10.6%, total and per day | Which operations are included in each comparison year |
| Legacy packaging business | -0.5%, total and per day | Whether the purchased grade, plant and end market match that perimeter |
| Difference between reported rates | 11.1 percentage points, our calculation | Aligned shipment levels before attributing a volume contribution |
The equal shipping-day basis removes one possible calendar explanation for the year-on-year comparison. It does not remove the business-scope difference. Treating the rate gap as acquired tonnage, or treating total growth as like-for-like customer demand, would introduce a conclusion the two rates cannot support.
Keep shipment evidence separate from availability and outlook
Management’s fourth-quarter demand and cost expectations are forward-looking statements, separate from observed Q3 shipments. The release also reports production and inventory information. Those describe operating flows and stocks, not an interchangeable measure of boxes sold or customer demand. [1]
For procurement, the next question is the matching scope rather than a stronger growth adjective. A buyer assessing a particular plant’s supply should request the relevant grade, location and delivery-period evidence. The legacy decline alone does not establish spare capacity at that plant; the wider increase alone does not establish tighter availability for that buyer.
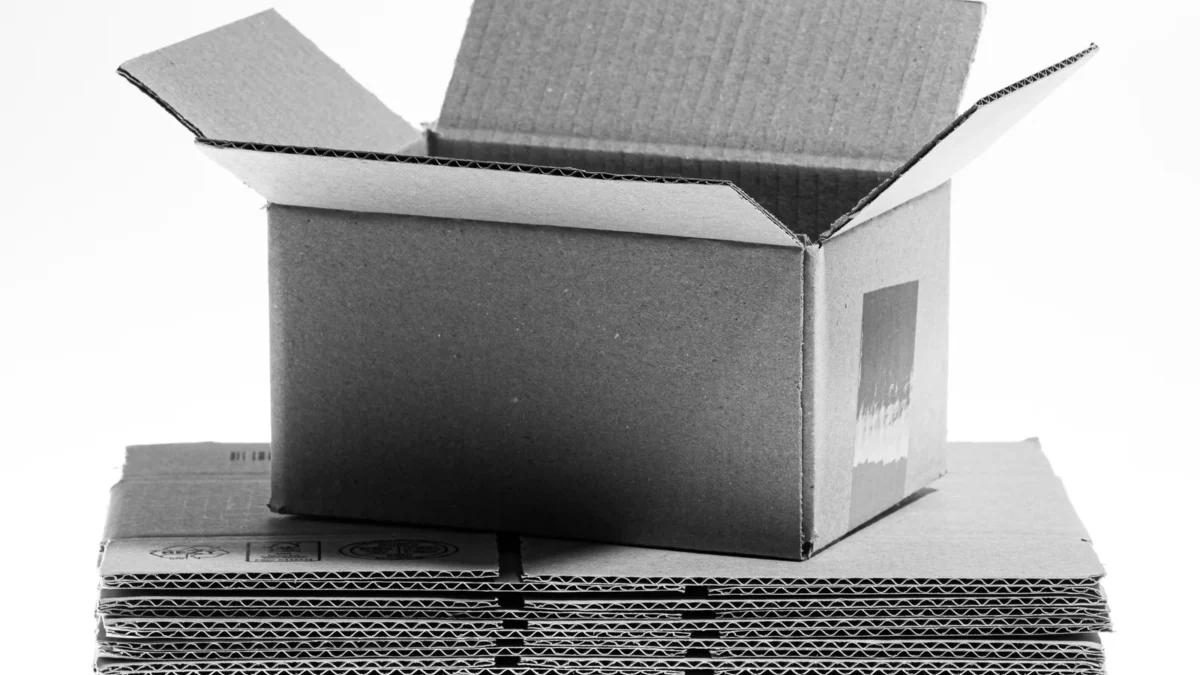
The photograph makes the same measurement boundary visible: an erected corrugated box and folded blanks show the physical format, not a count of PCA shipments. It is an independently licensed 2023 material-context photograph, not a record of PCA facilities or this quarter’s activity.
Retain the original date, reported perimeter and shipping-day basis beside each rate in a supplier comparison. The next comparable shipment release can test persistence; a changed perimeter must first be reconciled. For the broader measurement problem, see our packaging-demand evidence review.
Sources and image credit
Packaging Corporation of America. Third Quarter 2026 Results, Exhibit 99.1, release dated 21 October 2026. Shipment paragraph after the segment table; acquired-business discussion; outlook and forward-looking statements. Checked 25 October 2026. One issuer’s disclosure, not an independent market census.
Renmontom. Cardbord box sw 001, photographed 24 January 2023. Licensed CC BY-SA 4.0. Full composition retained, resized and converted to WebP; derivative remains under the same image license. No PCA identity or endorsement is implied.
Found an error? Read our corrections policy and contact the editors.