A packaging buyer can receive three quotations for the same tray and choose the lowest unit price.
That decision may still produce the highest total cost.
The reason is simple: packaging is not purchased at the factory gate and consumed at the factory gate. It has to be qualified, produced, packed, transported, cleared, stored, issued to operations and used successfully.
Every step can add cost or risk.
This is especially important for sustainable packaging because material choice often changes more than the package itself. It can also change:
- supplier base;
- minimum order quantity;
- lead time;
- container utilization;
- food-contact and sustainability documentation;
- component compatibility;
- recovery claims;
- inventory strategy.
The commercially useful comparison is therefore not:
“Which supplier has the lowest unit price?”
It is:
“Which qualified supply system delivers the lowest reliable cost at the point of use?”
Supply-chain map 1 — define the commercial boundary before comparing quotations
A quotation only has meaning when the commercial boundary is clear.
International Chamber of Commerce Incoterms® rules exist partly to make that boundary explicit by allocating delivery responsibilities, costs and risks between buyer and seller. [S1]
Under EXW, goods can be made available at the seller’s premises with much of the onward transport responsibility resting on the buyer. Under FOB, delivery and risk transfer occur on board the nominated vessel at the named port of shipment. Under DDP, the seller carries substantially more responsibility through to the named destination, including import clearance and duties. [S1]
Those are very different price boundaries.
In a hypothetical comparison, a USD 0.05 EXW quotation and a USD 0.055 delivered quotation cannot be compared by subtracting half a cent. The destination and the delivered term must be specified.
The missing transport and import layers have to be normalized first.
Supply-chain map 2 — unit price is only the first line of landed cost
A practical landed-cost model can include:
| Cost layer | Typical components | Why it varies |
|---|---|---|
| Goods | Package, lid, print, carton | Material, weight, performance, quantity |
| Origin | Factory loading, inland transport, export handling | Factory location, port, shipment size |
| Main freight | Ocean, rail, road or air | Route, season, disruption, capacity |
| Import | Duty, tax, broker, inspection, documentation | HS classification, origin, destination rules |
| Destination | Port handling, drayage, warehouse delivery | Port, distance, congestion, equipment |
| Inventory | Storage, financing, safety stock | MOQ, lead time, demand variability |
| Quality risk | Damage, rejects, rework, emergency replacement | Supplier capability and product fit |
| Obsolescence | Old artwork, regulation change, slow-moving SKUs | Large batches and long replenishment cycles |
Editorial cost framework, not a tariff schedule or accounting standard. Exclude costs already included in the chosen Incoterm, and distinguish recoverable taxes from expense. Certification is voluntary unless a specific rule or contract says otherwise. [S1] [S7]
Not every buyer includes every line in the same accounting bucket.
But every serious comparison should decide whether those costs exist and who is carrying them.
Supply-chain map 3 — disposable packaging is often a cube problem before it is a weight problem
Many foodservice packages are light.
They are also bulky.
Cups, clamshells, trays and bowls can fill a shipping container by volume long before they reach its allowable cargo weight.
That creates a distinctive packaging-supply-chain effect:
freight cost per piece depends heavily on nesting and carton cube.
Two 32-gram containers can have very different logistics economics if:
- one nests tightly and one leaves air space;
- one needs a protective insert;
- one uses a separate lid carton;
- one deforms if cartons are compressed;
- one has fewer pieces per master carton.
For lightweight disposable packaging, cubic efficiency can be as commercially important as material weight.
The “air freight” hidden inside bad nesting
Shipping literal air inside cartons sounds trivial until it is multiplied across tens of thousands of cases.
Poor nesting can increase:
- containers per annual volume;
- warehouse locations required;
- pallet handling;
- inland transport movements;
- packaging material used for master cartons.
This is one reason a heavier but better-nesting design can sometimes have a lower delivered logistics cost per unit than a lighter design.
Weight reduction and logistics efficiency should be evaluated together.
Supply-chain map 4 — one package can create a multi-component supply chain
A food container may be sold as one product but sourced as a system:
- base container;
- lid;
- liner or insert;
- label;
- printing;
- film seal;
- outer carton.
Sustainable-material substitution can make this more complicated.
For example, changing a container material may require:
- a different lid material;
- a different sealing temperature;
- a new barrier layer;
- a new food-contact declaration;
- a new compostability or recycling claim;
- different storage conditions.
A low-cost container is not a low-cost system if it creates a second supplier, a second MOQ or an incompatible lid inventory.
Supply-chain map 5 — MOQ is an inventory decision disguised as a purchasing term
Minimum order quantity affects much more than unit price.
A large MOQ can create:
- lower production cost per piece;
- more months of inventory;
- greater cash tied up in stock;
- more warehouse space;
- higher artwork-obsolescence risk;
- more exposure if demand changes.
A small MOQ may carry a higher unit price but reduce working capital and slow-moving inventory.
The correct economic comparison depends on demand stability.
For a high-volume plain cup used every day, a large production run may be efficient.
For a seasonal custom-printed SKU, the same order policy can create substantial obsolete stock.
Supply-chain map 6 — lead time should be divided into parts
“Lead time: 45 days” is often too vague for operational planning.
A packaging supply chain can contain:
- artwork approval;
- tooling or plate preparation;
- raw-material availability;
- production queue;
- manufacturing;
- quality release;
- booking;
- origin handling;
- main transport;
- port or border clearance;
- destination delivery.
Only some of those stages are controlled by the manufacturer.
The World Bank’s 2023 Logistics Performance Index framework covers customs, infrastructure, international shipments, logistics competence, tracking and tracing, and timeliness. This is a system-level framework, not a measured lead time for a particular supplier or a 2026 packaging survey. [S4]
Average lead time is less useful than lead-time reliability
In a hypothetical comparison, a supplier that usually delivers in 30 days but sometimes requires 70 can create more safety-stock exposure than one that consistently delivers in 40, depending on demand and the service level required.
For planning, a buyer should ask:
- What is the normal lead time?
- What is the 90th- or 95th-percentile lead time?
- Which stages are most variable?
- How much production is made to stock?
- How much is made to order?
- What happens when a vessel rolls or a port is congested?
Reliability determines inventory.
Supply-chain map 7 — freight volatility changes the value of regional supply
UN Trade and Development has documented how geopolitical disruption and rerouting can lengthen voyages, reduce effective shipping capacity and increase transport costs.
Its public 2025 review summary warns about longer journeys, delays and cost volatility. The full report was not accessible for this review; no route-level rate or lead-time figure is inferred from that summary. [S3]
That does not mean overseas supply is inherently unreliable or regional supply is inherently cheaper.
It means the value of distance changes when freight volatility changes.
Regional production may reduce:
- ocean-freight exposure;
- transit time;
- safety stock;
- port disruption risk.
But it may also have:
- higher conversion cost;
- smaller production scale;
- more expensive raw materials;
- limited tooling or material capability.
The buyer has to compare systems, not slogans such as “local is always better.”
Supply-chain map 8 — resiliency is not the same as reshoring everything
The OECD’s 2025 Supply Chain Resilience Review reaches an important conclusion for packaging procurement: simply relocalizing trade does not automatically create a more resilient system.
Its modeling found that broad relocalization scenarios could sharply reduce global trade and GDP without consistently lowering volatility. [S5]
OECD work published in 2026 also shows that global value chains remain deeply integrated, with international production being reconfigured rather than disappearing. [S6]
For packaging buyers, the practical lesson is:
resilience comes from visibility, alternatives and response capability—not only geographic proximity.
What does a resilient packaging supply base look like?
It may include:
- qualified backup tooling;
- more than one raw-material source;
- a secondary manufacturing site;
- alternative ports or transport modes;
- safety stock for long-lead items;
- local emergency supply for selected SKUs;
- standardized lid or footprint designs;
- documented change-control procedures.
Not every SKU needs all of these.
The cost of resilience should be proportional to the consequence of disruption.
Supply-chain map 9 — customs and product classification can change landed cost
Cross-border packaging does not move under a generic label such as “eco packaging.”
Customs treatment depends on product classification, material, origin and destination rules.
That can affect:
- duty;
- documentation;
- inspection;
- trade-remedy exposure;
- clearance time.
OECD trade-cost research has long identified documentation, customs compliance and administrative delay as components of total trade cost. [S7]
For sourcing teams, HS classification therefore belongs in the cost model before the purchase order is placed—not after the goods arrive at the border.
Supply-chain map 10 — sustainability documentation is part of supplier qualification
A sustainable packaging claim can introduce its own information supply chain.
Buyers may need evidence for:
- food contact;
- PFAS restrictions;
- recycled content;
- chain of custody;
- compostability;
- material composition;
- recyclability;
- country-specific labeling.
A package that arrives on time without the required documents may still be commercially unusable.
Supplier qualification should therefore ask two questions:
Can the factory make the product?
and:
Can the supplier continuously support the evidence needed to sell and use it?
Supply-chain map 11 — specification complexity creates hidden safety stock
Custom colors, printed designs, unique lid diameters and region-specific materials create SKU fragmentation.
Each unique combination can require:
- separate inventory;
- separate artwork;
- separate MOQ;
- separate production planning;
- separate compliance documentation.
A buyer can reduce supply-chain cost by reducing unnecessary uniqueness.
Examples include:
- using one lid across several bowl sizes;
- standardizing carton quantities;
- sharing base tooling across designs;
- using labels rather than unique printed runs where appropriate.
Packaging design is therefore also a supply-chain design decision.
Supply-chain map 12 — damage and reject rates belong in the denominator
If a buyer orders 100,000 packages and 2,000 are damaged, warped or unusable, the economic unit count is not 100,000.
A useful normalized metric is:
Total acquisition cost per usable unit = total included acquisition costs ÷ usable units received. A company may use “landed cost” more narrowly for goods, transport and import costs; keep that accounting boundary explicit.
This is especially relevant when comparing:
- brittle materials;
- moisture-sensitive fiber products;
- long-distance transport;
- thinwall articles;
- complex printed packaging.
A tiny factory-price saving can disappear if reject or damage rates differ.
The purchase cost of damaged units is already in the numerator and their exclusion is in the denominator. Do not add that purchase cost a second time. Only distinct incremental costs—such as disposal or emergency replacement freight—belong in an additional loss line.
The procurement comparison matrix
| Decision factor | What to compare | Typical hidden risk |
|---|---|---|
| Unit price | Same spec, quantity and Incoterm | Different commercial boundaries |
| MOQ | Units / SKU / design | Excess inventory |
| Cube efficiency | Pieces per carton / CBM / container | Paying freight for air |
| Lead time | Production + transport + clearance | Average hides variability |
| Inventory | Months of cover / safety stock | Cash and obsolescence |
| Components | Container + lid + seal + print | Multiple suppliers / incompatible inventory |
| Compliance | Finished-product evidence | Product cannot be used or claimed as intended |
| Quality | Reject / damage / dimensional consistency | Low usable yield |
| Resilience | Backups / alternate routes / change control | Single-point failure |
Editorial decision matrix; factors require actual product, shipment and qualification records. No supplier ranking or measured factory performance is implied. [S1] [S4] [S5]
A simple comparison example
Supplier A may quote about 9% less per unit than Supplier B.
But suppose Supplier A requires:
- twice the MOQ;
- one additional container because nesting is worse;
- six extra weeks of inventory;
- a separate lid supplier;
- more safety stock because lead time is less predictable.
That factory-price advantage is no longer the answer.
It is only the beginning of the calculation.
| Defined input | Supplier A | Supplier B |
|---|---|---|
| Ordered units | 100,000 | 100,000 |
| Goods cost, USD | 5,000 | 5,500 |
| Additional delivery/import costs, USD | 1,500 | 800 |
| Total included cost, USD | 6,500 | 6,300 |
| Usable units received | 98,000 | 99,500 |
| USD per usable unit | 0.06633 | 0.06332 |
Original hypothetical arithmetic, not quotes or observed performance. A: 6,500 ÷ 98,000; B: 6,300 ÷ 99,500. Same agreed specification/destination, no scrap recovery credit; financing, distinct disruption costs and recoverable taxes excluded. Add those only on a consistent basis.

Supply-chain conclusion
Sustainable packaging supply chains are harder to compare than unit price because the material decision changes the commercial system around the package.
MOQ changes inventory. Geometry changes freight. Components change supplier count. Qualification changes lead time. Incoterms® change the cost boundary. Customs change the landed result. Reliability changes safety stock. Documentation determines whether the package can actually be used and claimed as intended.
The lowest ex-factory quotation can still be the most expensive sourcing decision.
The stronger procurement question is:
“What does this package cost after qualification, conversion, transport, import, inventory, risk and expected usable yield are all included?”
That is the supply-chain number worth comparing.
Methodology and editorial note
This is a sourcing framework informed by the identified public ICC checklist, World Bank methodology and OECD findings. It is not product-specific customs or compliance advice. The two-supplier comparison is hypothetical and reproducible from the displayed inputs; financing and distinct disruption costs are excluded. Paid Incoterms clauses are not reproduced. Sources checked 19 October 2026. No supplier audit, factory inspection or independent market census was performed for this article.
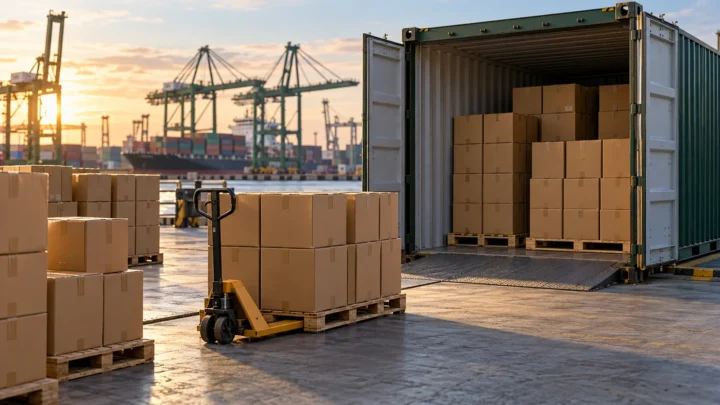
The main image is an AI-generated editorial illustration of a generic industry scene, not a named company, product or real event. The in-body figure is an original source-grounded synthesis or labelled calculation.
Official sources and reference notes
- [S1] International Chamber of Commerce. Incoterms® 2020: Checklist and Flowcharts. Official checklist; ©2022, file labelled 2024 update. pp4–6 decision checklist; pp7–12 buyer/seller decision flowcharts. Full public PDF checked; brief paraphrase of delivery/cost allocation, not reproduction of paid rule clauses. Accessed 19 October 2026.
- [S3] UN Trade and Development. Review of Maritime Transport 2025: official release summary. 24 September 2025. Public release summary: rerouting, longer journeys and volatile costs. Indexed official summary only; direct page/PDF access returned 403. No report-level numerical claim used. Accessed 19 October 2026.
- [S4] World Bank. Logistics Performance Index 2023. 21 April 2023. Six dimensions and logistics reliability. Official release/method description checked; historical 2023 framework, not a 2026 packaging lead-time dataset. Accessed 19 October 2026.
- [S5] OECD. OECD Supply Chain Resilience Review. 2025. Key findings: relocalisation scenario costs and volatility. Official public key findings checked; macro scenario, not a prediction for an individual buyer. Accessed 19 October 2026.
- [S6] OECD. Trends in Global Value Chains. 9 July 2026; DOI10.1787/8217c2ff-en. Abstract: 2024 real imported-input use; sector and sourcing reconfiguration. Official public abstract checked; no full-model or packaging-specific inference. Accessed 19 October 2026.
- [S7] OECD. Trade Costs — What Have We Learned?. 23 April 2013; DOI10.1787/5k47x2hjfn48-en. Public abstract: border and behind-the-border trade costs. Official abstract checked; historical framework, no current tariff classification/rate advice. Accessed 19 October 2026.
The public corrections channel is currently inactive. Read our corrections policy.