The public records reviewed here do not establish a single “sustainable packaging boom” between April and October 2026.
The public evidence points to something more useful: shipments strengthened in selected paper grades, company fiber results improved in some applications, and foodservice sales remained soft in one major producer’s reporting. These are different measures, with different coverage.
That conclusion matters because the phrase sustainable packaging demand can hide several different signals:
- physical shipments;
- converter sales;
- retailer material choices;
- certified-product counts;
- new production capacity;
- company order announcements.
The market-size and demand-data audit established the rule for this desk: those signals should not be treated as interchangeable.
This April–October update therefore asks a narrower question:
What observable market signals changed between 1 April and 19 October 2026—and what do they actually prove?
The research window is 1 April–19 October 2026, slightly longer than six calendar months. It is a review of records available in that window, not a matched six-month growth series. Q2, year-to-date and fiscal-year observations retain their own periods; Walmart’s fiscal-year change cannot be presented as a change that occurred between April and October.
Signal 1 — U.S. packaging-paper shipments strengthened, especially in bag and sack grades
A direct physical-shipment signal in the reviewed records came from U.S. packaging papers.
The American Forest & Paper Association reported that total packaging papers and specialty-packaging shipments were up 4% year over year in August 2026 and up 5% for the first eight months of the year. [S1]
The monthly pattern was positive but uneven:
- April shipments were up 5.5% year over year;
- May was up 12%;
- June was up 2%;
- July was up 1%;
- August was up 4%.
Each monthly percentage above compares that month with the same month in 2025; they must not be added into a cumulative growth rate. [S2]
Unbleached bag and sack shipments were particularly strong. AF&PA reported a new August record of nearly 119,000 short tons and an 8.4% year-to-date increase. [S1]
This is stronger evidence than a consumer survey because it measures actual industry shipments. [S1] [S2]
It is still not a complete measure of “sustainable packaging demand.” The AF&PA series covers specific U.S. packaging-paper grades, not all fiber packaging, not converted foodservice articles, and not global packaging.
Signal 2 — boxboard improved, but the broader paper-packaging picture was not uniformly strong
AF&PA also reported that total U.S. boxboard production increased 2% in the second quarter of 2026 compared with the same quarter in 2025. [S3]
At the same time, boxboard operating rate was 88.8%, slightly below the year-earlier quarter.
Containerboard showed a more complicated pattern: its Q2 operating rate rose to nearly 95% from 93% in Q1, while production fell 2% year on year. AF&PA reported domestic demand up 1% but exports down nearly 19%. Higher utilization therefore did not mean higher total output, and domestic demand did not track exports. [S13]
These numbers support a recovery or stabilization narrative in selected paper-packaging segments.
They do not prove that every paper package category is expanding. Different grades serve different markets, and production can move differently from downstream consumption.
Signal 3 — molded-fiber demand improved in produce applications, not across every foodservice use
Huhtamaki’s second-quarter results provide a more application-specific signal.
Its Fiber Packaging segment reported 7% comparable net-sales growth in Q2 2026 and 6% growth for the first half. The company said demand improved for egg and fruit packaging, while demand remained stable for food-on-the-go products. [S4]
That distinction is important.
It suggests that fiber substitution or growth should not be discussed as one market.
Produce protection, egg packaging, drink carriers, takeaway containers and hot-food serviceware have different performance requirements and different demand cycles.
Huhtamaki’s figures are company-reported, not an industry census. But they are useful because they connect sales growth to specific end-use categories rather than simply stating that “fiber packaging is growing.”
Signal 4 — recycled paperboard also showed stronger operational demand
Sonoco reported that North American uncoated recycled paperboard trade-ton sales volume increased 6% in the second quarter of 2026. [S6]
The company also reported a 9% increase in EMEA/APAC paper-can sales volume. [S6]
Again, this is not a global recycled-packaging index.
But it is a concrete operational signal from a large packaging producer that recycled-paperboard demand strengthened in at least part of the North American market during the period.
The strongest interpretation is therefore:
fiber and recycled-paperboard demand showed measurable strength in selected grades and applications during the first eight months of 2026.
The weaker interpretation—“all sustainable fiber packaging is booming”—is not supported.
Signal 5 — foodservice packaging remained a weak spot
The same Huhtamaki results provide the counter-signal.
Foodservice Packaging comparable net sales declined 1% in Q2 and 4% in the first half of 2026. In the first quarter, the company had described market demand as soft. [S4] [S5]
This matters because foodservice packaging is one of the categories most closely associated with material substitution from conventional plastic toward paper, molded fiber, coated fiber and compostable formats.
If the end market is weak, a sustainability transition can continue while total package demand remains soft.
That is why the demand equation should be separated into:
end-market volume × material share × package intensity.
A sustainable material can gain share inside a category even while the category itself contracts.
Signal 6 — combined packaging volumes grew modestly, but sustainability-specific demand remains hard to isolate
Amcor estimated June-quarter 2026 volumes about 0.5% above combined legacy Amcor and Berry volumes a year earlier, excluding non-core and divested businesses. Its SEC-filed release provides a combined-business measure; it does not support the draft’s 1% flexible-segment claim. [S7]
This is useful context for packaging demand.
It is not evidence that sustainable flexible packaging grew 0.5%.
Amcor supplies several packaging types. The combined volume measure does not isolate recyclable, recycled-content or other sustainability attributes.
So this signal belongs in the article as a market baseline, not as proof of sustainability-specific volume.
Signal 7 — recycled-content procurement moved from target language into measurable portfolio change
One of the strongest buyer-side signals came from Walmart’s FY 2026 packaging disclosure.
Walmart reported that post-consumer recycled content represented an estimated 12.0% of its North American private-brand plastic packaging and 10.7% globally. In FY 2025, the comparable figures were 8.2% and 7.6%. [S8]
That is not a stated-preference survey. It is a reported change in the composition of a very large buyer’s private-brand packaging portfolio.
Walmart also reported that 81.1% of global private-brand plastic packaging was designed for recycling and that 64.3% of global private-brand packaging was recyclable, reusable or industrially compostable. [S8]
But the same disclosure provides an important counterpoint: reported private-brand virgin-plastic packaging was still 4.12% above the FY 2021 baseline rather than meeting the company’s 15% reduction goal. [S8]
This is precisely why portfolio-level evidence is more useful than a single sustainability target.
Recycled content can rise while absolute virgin-plastic use does not fall as planned.
Signal 8 — compostable packaging continued to commercialize, but public demand data remain thin
Compostable packaging has a recurring measurement problem: certification activity and production capacity are visible, but broad public sales-volume data are not.
The BPI catalog retrieved on 19 October 2026 listed 51,069 items across finished products, materials and components. The draft’s July and September counts were not supported by retained dated snapshots, so no catalog growth rate is reported here. [S9]
That current listing count does not measure sell-through, shipment volume or consumer demand.
A certified SKU may sell millions of units, a few thousand units, or nothing during a given period.
Catalog listings indicate the breadth of certification coverage. They do not by themselves establish commercial availability, factory output, local facility acceptance or demand.
Signal 9 — the new NatureWorks Thailand plant is a supply response, not independent demand proof
NatureWorks opened its new integrated PLA plant in Nakhon Sawan, Thailand on 29 April 2026, with approximately 75,000 metric tonnes of annual nameplate capacity. [S10]
The company said the facility is intended to support growing demand for low-carbon and bio-based materials in applications including flexible packaging and compostable foodserviceware, particularly across Asia-Pacific.
That is strategically important.
The market-data distinction still applies: a producer opening capacity because it expects or sees demand is not the same as independently observed end-market demand.
The strongest factual statement is:
The company announced the opening of additional PLA nameplate capacity in Asia-Pacific during the review window. Opening and nameplate capacity do not establish the quantity actually produced or qualified for packaging.
Whether that entire nameplate capacity is rapidly absorbed by packaging customers will need to be tested later through utilization, sales and customer-qualification evidence.
Signal 10 — company-level compostable orders show adoption, but not yet a market-wide curve
At a much smaller scale, NEXE Innovations reported in June that approximately 300,000 compostable coffee pods had been delivered under one partner transition, with two additional brands providing initial purchase orders. [S12]
This is useful because it represents actual shipments and purchase orders rather than a technology announcement.
It is also narrow evidence:
- one product format;
- one supplier platform;
- a limited customer group;
- company-reported data.
It supports the claim that compostable formats continue to find commercial applications.
It does not establish the growth rate of the global compostable-packaging market.

What changed most clearly?
| Signal | Observed evidence | What it supports | What it does not prove |
|---|---|---|---|
| U.S. packaging papers | Shipments +5% YTD through August; unbleached bag & sack +8.4% YTD [S1] | Stronger physical shipment demand in selected paper grades | Global sustainable-packaging growth |
| Fiber packaging | Huhtamaki Fiber Packaging comparable sales +7% Q2; egg/fruit demand improved [S4] | Stronger selected molded-fiber end uses | Uniform growth across foodservice fiber |
| Recycled paperboard | Sonoco North American URB trade-ton volume +6% Q2 [S6] | Operational recycled-paperboard demand growth | Global recycled-packaging demand |
| Foodservice | Huhtamaki Foodservice comparable sales -1% Q2 and -4% H1 [S4] | Soft end-market conditions | Failure of material substitution |
| Recycled content | Walmart PCR share rose to 12.0% North America / 10.7% global [S8] | Measurable buyer-side material adoption | Absolute virgin-plastic reduction |
| Compostables | 51,069 catalog items on 19 October; separate company-reported pod deliveries [S9] [S12] | Breadth of certification coverage; narrow commercial order activity | Market-wide sales volume |
| PLA capacity | Producer-announced opening; 75,000 t/y nameplate [S10] | Large new regional supply capacity | 75,000 tonnes of immediate realized demand |
Mixed evidence, not a common growth series: shipments, company comparable sales, fiscal-year portfolio shares, certification listings and nameplate capacity have different denominators. No aggregate growth score is calculated.
What did not change?
The structural limitation identified in the market-data audit remains in place.
There is still no single official dataset measuring global demand for “sustainable packaging.”
Public evidence continues to be split among:
- industry shipment series;
- company segment disclosures;
- retailer packaging portfolios;
- certification databases;
- new capacity announcements;
- individual commercial orders.
That fragmentation is not a reason to stop measuring the market.
It is a reason to stop pretending one CAGR can summarize it.
The pattern: material substitution and total demand need separate measures
The reviewed records show material substitution and portfolio redesign alongside uneven end-market conditions. They do not quantify which effect was larger across the whole market.
Examples include:
- higher recycled-content share in Walmart private-brand plastics;
- strength in unbleached packaging papers;
- improved egg and fruit fiber packaging demand;
- continued commercialization of compostable formats;
- new PLA capacity positioned for Asian demand.
At the same time:
- foodservice demand remained soft in Huhtamaki’s reporting;
- not all paper grades accelerated equally;
- recycled-content gains did not automatically reduce absolute virgin plastic;
- compostable certification growth did not provide shipment data.
This is a more credible market narrative than “sustainable packaging demand is booming.”
What should buyers and suppliers watch next?
For the next six-month update, the most useful indicators will be:
- Paper shipments: whether U.S. packaging-paper gains persist into Q4 2026.
- Fiber applications: whether egg/fruit strength expands into food-on-the-go and foodservice.
- Recycled content: whether large buyers continue raising actual PCR share rather than only design-for-recycling metrics.
- PLA utilization: whether newly commissioned Asian capacity translates into observable customer qualification and sales.
- Compostable sales: whether more suppliers disclose shipment volumes instead of certification counts alone.
- End-market demand: whether foodservice volumes recover enough to amplify material-substitution gains.
- Regional divergence: whether Asia-Pacific packaging growth continues to outpace mature markets in company volume reporting.
Market pulse conclusion
Between April and October 2026, the strongest public evidence did not show one synchronized sustainable-packaging growth cycle.
It showed a market moving through several transitions at once.
Paper-packaging shipments improved in the United States. Selected molded-fiber and recycled-paperboard applications strengthened. A major retailer increased the recycled-content share of its private-brand plastic packaging. PLA supply capacity expanded in Asia-Pacific. Compostable-product availability continued to broaden.
But foodservice demand remained soft in some channels, virgin-plastic reduction remained difficult even where PCR use increased, and public demand data for compostable packaging remained sparse.
The evidence-bounded verdict is therefore:
Selected shipment and buyer-portfolio measures improved, but the evidence does not establish a universal sustainable-packaging growth rate. Measure substitution, end-market volume and qualified supply separately.
Methodology and editorial note
The review window is 1 April–19 October 2026. Observation periods differ: Q2 results, year-to-date shipments and fiscal-year portfolio disclosures do not form a matched six-month series. Company statements remain attributed, certification listings are not sales, and nameplate is not output. Unsupported historical catalog snapshots and the draft’s unverified flexible-segment volume claim were replaced. Sources checked 19 October 2026. No supplier audit, factory inspection or independent market census was performed for this article.
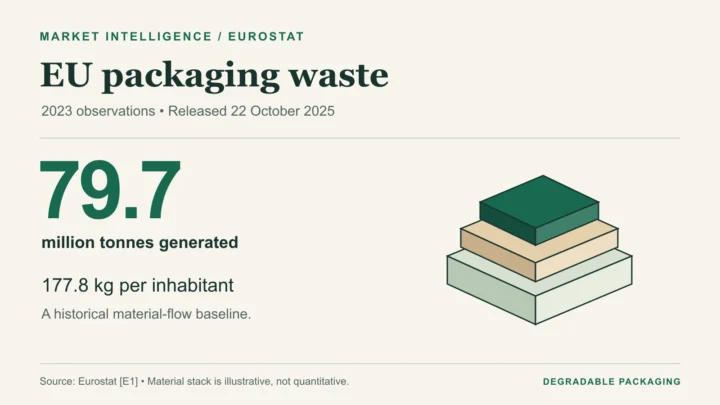
The main image is an AI-generated editorial illustration of a generic industry scene, not a named company, product or real event. The in-body figure is an original source-grounded synthesis or labelled calculation.
Official sources and reference notes
- [S1] American Forest & Paper Association. August 2026 Packaging Papers Monthly Report. 17 September 2026. Opening shipment, YTD and unbleached bag/sack paragraphs. Full public release checked, not subscription tables; U.S. defined grades. Accessed 19 October 2026.
- [S2] American Forest & Paper Association. April–July 2026 Packaging Papers Monthly Reports. 2026 monthly public releases. April +5.5%; May +12%; June +2%; July +1%, each year-on-year. Public statistics index and individual release extracts checked; underlying subscription survey not audited. Accessed 19 October 2026.
- [S3] American Forest & Paper Association. Q2 2026 Boxboard Quarterly Report. 31 July 2026. Production +2% YoY; operating rate 88.8%. Full public release checked; production and operating rate are separate metrics. Accessed 19 October 2026.
- [S4] Huhtamäki Oyj. Half-yearly report January 1–June 30, 2026. 23 July 2026. Comparable sales by segment Q2/H1; Fiber Packaging end-use commentary. Full relevant company release checked; sales are not a market-volume census. Accessed 19 October 2026.
- [S5] Huhtamäki Oyj. Interim Report January 1–March 31, 2026. 29 April 2026. Foodservice Packaging demand commentary. Full relevant company release checked; historical Q1 observation. Accessed 19 October 2026.
- [S6] Sonoco Products Company. Second Quarter 2026 Results. 22 July 2026. Industrial Paper Packaging; North American URB trade tons; EMEA/APAC paper cans. Relevant issuer result checked; regional company-level volumes. Accessed 19 October 2026.
- [S7] Amcor plc / SEC. Fiscal 2026 Fourth Quarter and Full Year Results. 12 August 2026; June 2026 quarter. Financial results, p2: estimated combined legacy-business volume +0.5%, excluding non-core/divested businesses. Relevant SEC exhibit checked. Original draft’s +1% flexible-segment/geography claim not supported by this exhibit; replaced. Accessed 19 October 2026.
- [S8] Walmart Inc. Waste and Circularity — FY 2026 ESG disclosure. FY 2026 disclosure checked 19 October 2026. Packaging portfolio: PCR shares, design metrics, virgin plastic vs FY 2021. Relevant public self-report checked; fiscal-year portfolio measure, not April–October shipment data. Accessed 19 October 2026.
- [S9] Biodegradable Products Institute. Certified Product Catalog. Catalog snapshot 19 October 2026. 51,069 items listed in retrieved catalog footer; scope of product categories. Current catalog checked. Earlier July/September counts lack retained snapshots and are omitted. Accessed 19 October 2026.
- [S10] NatureWorks LLC. Grand Opening of Fully Integrated Ingeo Biopolymer Manufacturing Facility in Thailand. 29 April 2026. Nakhon Sawan site opening; approximately 75,000 metric tonnes/year nameplate. Full relevant company announcement checked. Does not establish actual output or demand absorption. Accessed 19 October 2026.
- [S12] NEXE Innovations Inc. Update on Partner Transition to BPI-Certified Compostable Pods. 22 June 2026. Approximately 300,000 pods delivered as of early May; two initial purchase orders. Public issuer release via GlobeNewswire checked; not independently verified sell-through. Accessed 19 October 2026.
- [S13] American Forest & Paper Association. Q2 2026 Containerboard Quarterly Report. 31 July 2026. Operating rate nearly 95%; production −2% YoY; domestic demand +1%; exports nearly −19%. Full public release checked; includes material contrary production/trade evidence. Accessed 19 October 2026.
The public corrections channel is currently inactive. Read our corrections policy.