
Executive Summary
In 2027, the same package can face different evidence requirements in different markets. This report compares which rules apply, what supplier disclosures measure and which recovery routes a buyer can verify. A procurement team can use those three checks to decide whether to qualify a construction, request better evidence or defer a purchasing decision.
The 2027 sustainable packaging trends overview surveys changes across the sector. This report examines what procurement teams can establish from legal texts, operating records and evidence from recovery systems.
The evidence points to different implementation paths across markets. The European Union is implementing its Packaging and Packaging Waste Regulation (PPWR) after the rules began applying on August 12, 2026. The United Kingdom has published its 2027 Recyclability Assessment Methodology (RAM), which tests packaging against collection, sorting, reprocessing and applications for recovered material. California’s SB 54 program has moved from rulemaking into implementation, while Oregon’s producer-responsibility reforms began changing operations in 2025. These programs do not create identical duties, but they reinforce the idea that packaging choices increasingly have consequences beyond the converter’s factory gate. S02 S03 S04 S05
The waste baseline remains challenging. Eurostat’s October 22, 2026 release reports 81.5 million tonnes of packaging waste generated in the EU in 2024, equivalent to 181.0 kg per person. Its plastic packaging recycling rate was 42.4%, up from 41.6% in 2023. The reported increase in recycling did not prevent an increase in per-capita plastic packaging waste. These are 2024 observations published in 2026, not measured 2027 outcomes. S01
China deserves a central position in any credible global outlook. The National Bureau of Statistics reported 74.87 million tonnes of plastic products in 2025—a broad industrial category, not a packaging-only or biodegradable-plastics figure. China’s postal regulator recorded 198.95 billion express deliveries in 2025. More importantly for the supply side, listed Chinese companies disclose actual output, sales and capital spending on biodegradable resins, recycled polymers, fiber-based packaging and food-contact paper. Their filings show industrial depth, but they also expose a vital distinction: announced nameplate capacity is not the same as production, profitable sales or proven environmental performance. S07 S08 S10 S11 S12 S13 S14
Six Key Findings for 2027
- Implementation matters more than distant targets. Packaging decisions in 2027 will increasingly depend on requirements and deadlines already taking effect.
- Recovery depends on the complete packaging construction. Materials, coatings, labels, closures and local collection systems all affect whether a package can be recovered.
- China is central to the supply-side transition. China’s polymer producers, paper manufacturers and packaging converters operate at significant scale. Announced capacity, qualified production and commercial sales measure different things.
- Environmental claims require product-specific evidence. Chemical restrictions, certifications, recycled-content declarations and food-contact records must match the finished item and the applicable market.
- Reuse and compostability depend on operating infrastructure. Actual reuse cycles and composting depend on functioning return or collection and processing systems.
- Total system cost matters more than unit price alone. Product protection, transport, compliance, handling and recovery can change the economics of a packaging choice.
The 2027 editorial forecast is therefore a conditional one: packaging solutions that combine reliable functionality, traceable evidence, commercially sustainable production and an end-of-life route suitable for the destination market are better positioned than products marketed only through a green-sounding material name. This is an analytical interpretation of current signals, not a quantified forecast of market shares or a claim that any material always performs better.
1. Why 2027 Is a Transition Year, Not a Finish Line
Packaging sustainability has spent much of the past decade in the language of substitution: plastic to paper, fossil-based resin to bio-based resin, virgin plastic to recycled plastic, or disposable to reusable. Substitution can remove an important problem, but it can also shift burdens from one part of a system to another. A heavier construction may affect transport. A coating that improves food protection may complicate fiber recovery. A compostable product may have no suitable collection route. A durable container may not deliver environmental benefits if it is rarely returned.
By November 2026, the operational questions have become harder to avoid. The issue is no longer only whether an innovation can be demonstrated. It is whether a buyer can specify it, source it consistently, lawfully use it, substantiate its claims and manage it after use. A material innovation that clears laboratory testing but fails a converter’s sealing line is not a deployable packaging solution. A factory’s announced output does not demonstrate demand. A recycling symbol does not guarantee collection.
There is a timing discipline here. A law’s adoption date, entry into force, date of application and later technical milestones may be different. A requirement scheduled for 2030 should not be presented as a 2027 obligation. Likewise, an investment announced in 2026 should not become recorded 2027 production merely because its commissioning schedule looks credible. This report uses observed evidence, confirmed future requirements, emerging signals and editorial scenarios as distinct categories.
It also avoids a false global average. The food-contact package used in a European city, the shipping box used across China’s parcel network, and the reusable transport crate managed by a closed distribution loop do not face identical technical, economic or recovery conditions. The meaningful unit of analysis is the package in its application and destination system.
2. Research Method: What Counts as a Strong 2027 Signal?
The evidence cutoff is November 4, 2026. Our primary documentary sources are official legal texts and regulator guidance, public statistics, listed-company annual reports and identifiable research reports. Company figures are described as company-reported unless independently verified. Announced projects, design capacities, actual output, shipments, sales and profitability are not interchangeable. Scientific summaries support their stated findings but do not prove conditions that were not examined in the underlying method.
For packaging claims, seven distinctions control the analysis: recycled content versus recyclability; recyclable design versus recycling in practice; bio-based versus biodegradable; industrial compostability versus facility acceptance; reusable design versus achieved reuse cycles; material certification versus finished-item scope; and an environmental indicator versus whole-system superiority. This report does not rank materials across incompatible functional units.
This report compares public regulations, official waste and industry statistics, and selected manufacturer disclosures. The companies illustrate different supply-chain roles. They are a purposive sample, so the report draws no estimate of national capacity or market share from them. The scenarios are editorial interpretations with observable triggers. The research uses public records and includes no original survey, lifecycle assessment, interviews or factory inspections.
Editorial disclosure
Bioleader is a disclosed industry and commercial related party of Degradable Packaging. Its statements are attributed to the company. See our Editorial Policy.
3. The Baseline: More Recovery Does Not Automatically Mean Less Waste
Eurostat’s 2024 packaging-waste figures, published in October 2026, are one of the clearest current reference points. EU packaging waste generation reached 81.5 million tonnes, equivalent to 181.0 kg per inhabitant. Paper and cardboard accounted for 40.8% by weight, plastic for 19.9%, glass 18.1%, wood 16.2%, metal 4.8%, and other materials 0.2%. Plastic packaging waste amounted to 35.9 kg per person, of which 15.3 kg was reported recycled. The plastic packaging recycling rate rose from 41.6% in 2023 to 42.4% in 2024. S01
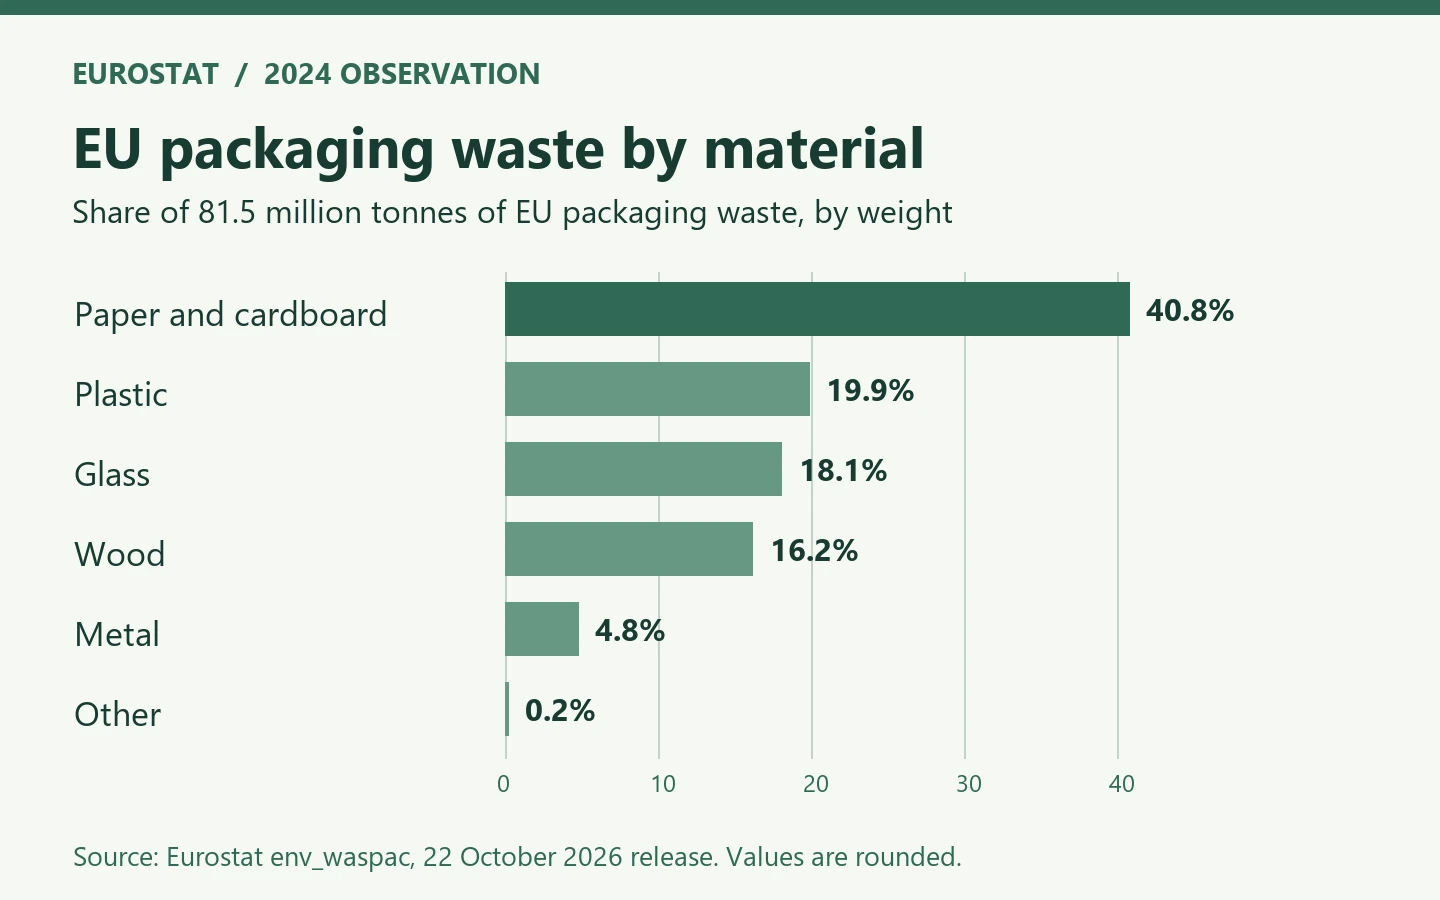
These numbers should not be mistaken for packaging sales or the size of the sustainable packaging market. They are recorded waste flows, not retail value, production capacity or the percentage of new packaging that contains recycled material. The waste denominator includes packaging discarded by households, commerce and government. Even the word recycling needs its reporting definition: Eurostat describes methodological changes introduced in 2020, including a harmonized calculation point and different treatment of composite packaging fractions. Comparisons across older periods require care.
The difference between increased recycling and waste prevention is significant. A region can recycle more tonnes while also placing more packaging into circulation. Better sorting or collection therefore need not eliminate the case for source reduction. Conversely, a reduction in packaging weight is not proof of an overall impact reduction if it causes more damaged products or changes transport and food-loss outcomes. The relevant counterfactual is the full packaging service provided.
The OECD’s Global Plastics Outlook, based on 2019 data, estimated that only 9% of plastic waste was ultimately recycled after accounting for recycling losses. That is a different geographic, temporal and methodological measure from Eurostat’s EU packaging-specific rate for 2024. They should not be put into a single trend chart as though they measure the same system. Their combined lesson is narrower and stronger: plastic circulation remains constrained by collection, sorting, losses and end markets, and performance changes by material and geography. S18
The Ellen MacArthur Foundation’s 2025 Global Commitment progress report supplies a separate, signatory-based view of the gap between design ambition and system deployment. It reports that brand and retail signatories’ reusable plastic packaging represented 1.2% of their reported plastic packaging, while design-for-recycling indicators had progressed further. Those are disclosures from a defined group of signatories, not a global census. The contrast suggests that scaling the operating model of reuse can be much harder than changing a material specification. S20
Baseline comparison: four numbers that should not be combined
| Measure | Recorded figure | Geography and period | Meaning and limitation |
|---|---|---|---|
| Packaging waste generated | 81.5 million tonnes | EU, 2024; released October 2026 | Waste, not sales or sustainable packaging market demand |
| Plastic packaging recycling rate | 42.4% | EU, 2024 | Material-specific EU recycling rate; not global plastic recovery |
| Plastic products output | 74.87 million tonnes | China, 2025 | All plastic products; not packaging-only output |
| Express deliveries | 198.95 billion items | China, 2025 | Delivery activity; not number or weight of packaging units |
Each row is intentionally left in its original statistical category. Addition or direct ranking would be misleading. S01 S07 S08
4. Regulation: The Application Calendar Becomes a Design Constraint
4.1 European Union: PPWR is already in application, with important later milestones
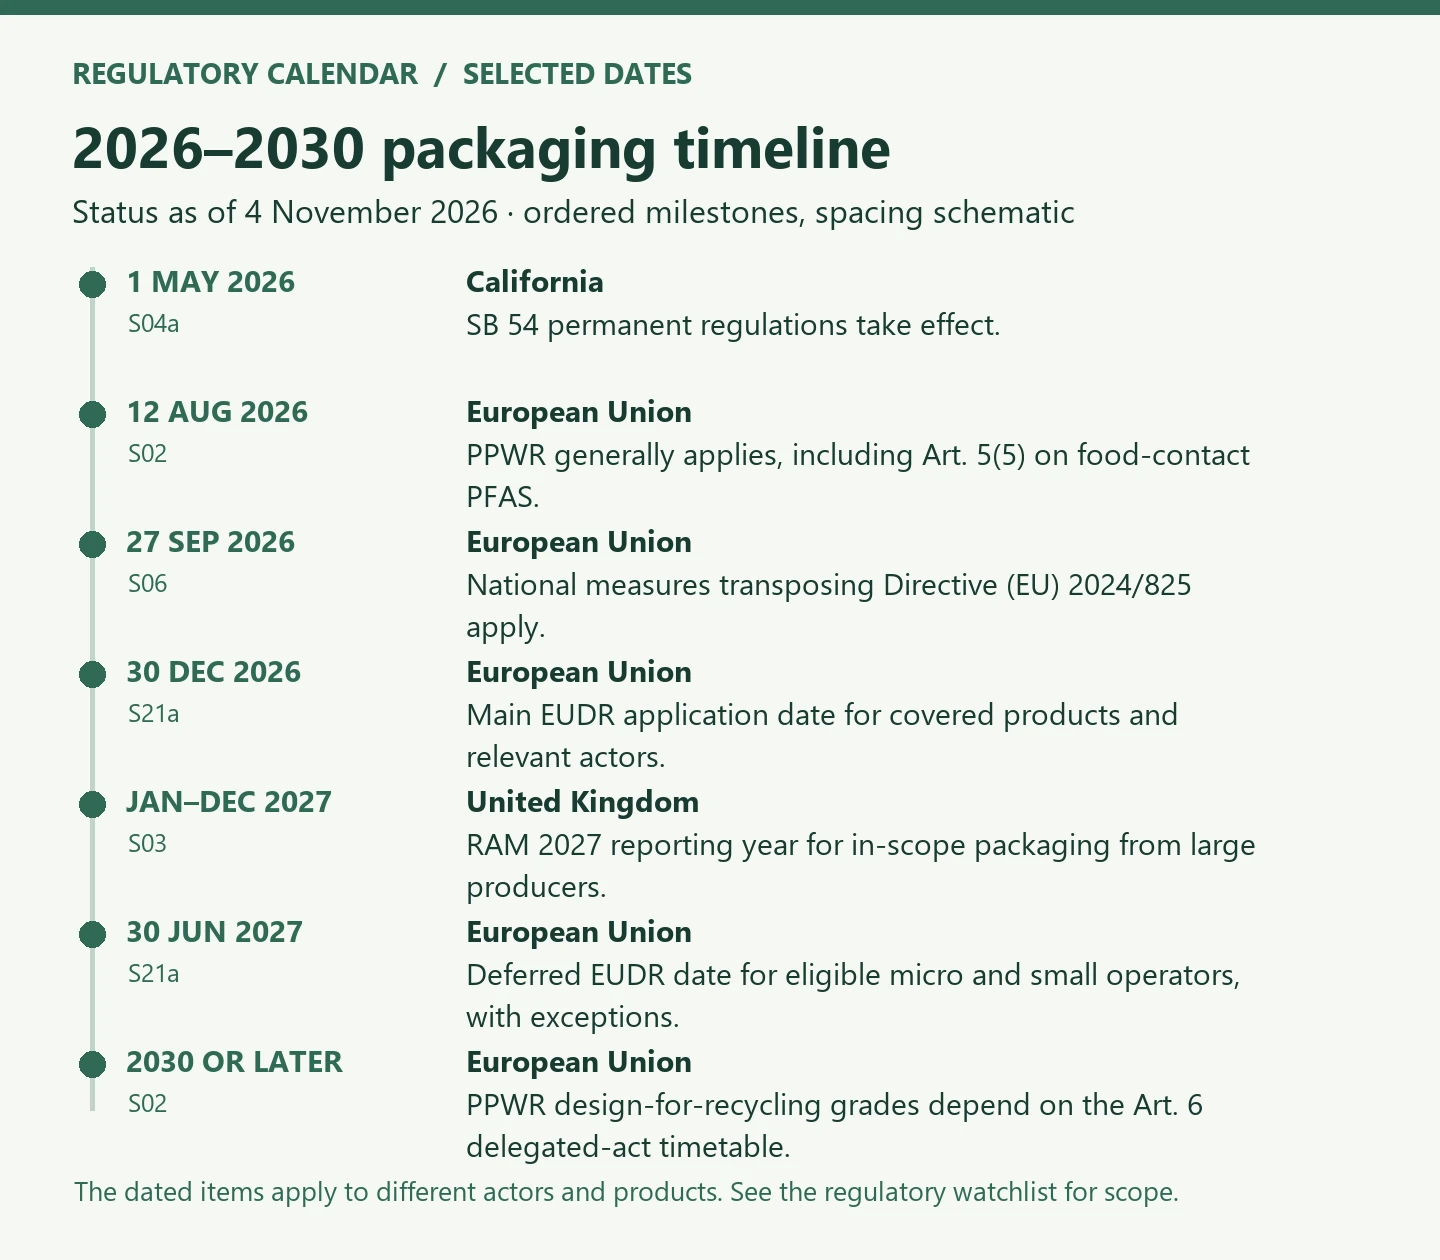
Regulation (EU) 2025/40—commonly called the PPWR—began applying on August 12, 2026. The regulation is part of the EU effort to reduce packaging waste, improve circularity and harmonize packaging-related rules across the single market. Its requirements cover several different subjects, including composition, substances of concern, recyclability, minimization, reuse and recycled content, but they do not all share one application date. S02
One already-applicable provision concerns PFAS in food-contact packaging. Article 5(5) contains thresholds and analytical definitions; the operative restriction is more specific than a blanket statement that every detectable fluorine atom constitutes prohibited PFAS. A company assessing compliance needs the exact finished packaging construction, relevant substances and analytical methods. European Commission guidance published in 2026 discusses how different testing approaches relate to the restriction. Generic supplier statements such as ‘PFAS-free’ are not a substitute for current product-specific evidence. S02 S23
For 2027, buyers should document the construction and applicable provisions before later requirements take effect. The Commission reads the general recyclability obligation in Article 6(1) as applicable since August 12, 2026. The separate design-for-recycling criteria in Article 6(2)(a) apply from January 1, 2030 or 24 months after the Article 6(4) delegated acts enter into force, whichever is later. Article 6(3) gives the same trigger for the A–C grade market-access rule, subject to Article 6(10). Our packaging regulations coverage tracks implementation separately. S02 S23
The EU’s Empowering Consumers for the Green Transition Directive (EU) 2024/825, applicable from September 27, 2026 following national transposition, adds another reason to revisit environmental marketing claims. It addresses misleading generic environmental claims and unreliable sustainability labels within its defined consumer-protection framework. Its legal mechanism and applicability are separate from the PPWR. Packaging teams should therefore coordinate material documentation and the marketing language that translates it into customer-facing claims. S06
4.2 United Kingdom: ‘recyclable’ is evaluated through a working system
PackUK’s RAM 2027 is a particularly useful example of the shift in emphasis. Published in July 2026 and updated in August, it applies for the 2027 reporting year to in-scope packaging supplied by large producers under packaging EPR. PackUK identifies household packaging and packaging that commonly ends up in public bins. RAM version 1.1 continues to govern the 2026 reporting year. The distinction matters: the regulatory text itself does not permit users to apply a later year’s methodology retrospectively by convenience. S03
RAM 2027 assesses packaging through four operational stages: collection, sortation, reprocessing and application of recycled material. Its assessment can consider a whole integrated packaging item or individual components, depending on classification rules. It asks whether proven infrastructure has the capacity to handle volumes at scale. This reframes the packaging question. A structure that appears recyclable in a controlled process may be rated differently if it is not commonly collected, is not effectively sorted, compromises reprocessing or has no established viable end use. S03
For suppliers outside Britain, the practical impact can arrive through buyers’ specifications before it arrives through a direct legal obligation on the supplier. Procurement teams may request information on adhesives, sleeves, pigments, barrier layers, labels and components that previously seemed secondary. But a RAM rating for one UK material category cannot automatically serve as a recyclability certificate for the same item in another country.
4.3 United States: implementation is state-specific
California’s SB 54 creates an extended producer responsibility framework for packaging and single-use plastic foodservice ware. The permanent implementing regulations took effect on May 1, 2026. S04a As of early November 2026, its regulator was assessing a producer responsibility organization’s submitted plan, with public comments invited through November 13. This is a live implementation process, not a single settled nationwide US standard. S04
Oregon’s Plastic Pollution and Recycling Modernization Act began changing recycling operations in July 2025 and assigns producers a role in financing and modernizing the system. Its design and institutional arrangements differ from California’s. Other US jurisdictions require their own legal review rather than assuming that a material which meets one state’s requirements meets every state’s rules. S05
For 2027 purchasing, the decisive questions are who legally counts as the producer, what packaging is covered, what data must be submitted, which deadlines apply, and how fees or design incentives are implemented. Exporters should not assume the factory shipping the item is always the entity with reporting duties. Conversely, they should not assume a manufacturer’s location removes a brand owner’s obligations in the destination market.
4.4 Forest-risk and other cross-cutting supply-chain requirements
Under the amended EU Deforestation Regulation (EUDR), the main application date is December 30, 2026. Article 38 provides a June 30, 2027 date for eligible natural-person, micro or small operators established as such by December 31, 2024, except for products covered by the former EU Timber Regulation annex. Check the product’s Annex I classification and the operator’s role. Delegated Regulation (EU) 2026/2102 amends that list, with separate application notes for specified additions. S21c The Commission’s guidance distinguishes covered packing articles traded in their own right from wooden packing used exclusively to carry another product. S21 S21a S21b
International plastics-treaty negotiations also matter as a policy signal, but negotiations must not be converted into enacted requirements. The UN Environment Programme records a February 2026 resumed session that was organizational rather than substantive. Any future global treaty outcome must be rechecked against its actual negotiated and ratified status. S24
Regulatory watchlist for packaging teams
| Date or period | Scope and legal reference | Buyer check |
|---|---|---|
| 1 May 2026 | California SB 54 permanent rules effective for covered producers and materials. The producer responsibility plan was open for comment through November 13, 2026. S04 S04a | Identify the responsible producer, covered materials and plan status. |
| 12 Aug 2026 | EU PPWR general application (Art. 71). Art. 5(5) concerns food-contact packaging first placed on the EU market. S02 S23 | Match the finished packaging and analytical scope to the applicable thresholds. |
| 27 Sep 2026 | Application of national measures under Directive (EU) 2024/825, Art. 4, for consumer-facing practices. S06 | Check national rules, environmental claims and label basis. |
| 30 Dec 2026 | Main EUDR date for specified obligations under amended Art. 38(2) and covered Annex I products. S21a S21b | Determine the product classification, actor and packing context. |
| Jan–Dec 2027 | UK RAM 2027 reporting year for in-scope packaging from large producers, including household packaging and packaging commonly discarded in public bins. S03 | Assess components and verify collection, sorting, reprocessing and end use. |
| 30 Jun 2027 | EUDR Art. 38(3) deferral for eligible natural-person, micro and small operators established by December 31, 2024, except products in the former EU Timber Regulation annex. S21a | Verify establishment date, actor category and product coverage. |
| 2030 or later | PPWR Art. 6(2)(a) and 6(3) design-for-recycling milestone. The later of January 1, 2030 and 24 months after relevant delegated acts enter into force applies. The grade rule is subject to Art. 6(10). S02 S23 | Track delegated acts, grade criteria and exceptions. |
The calendar is not a universal legal checklist. Specific provisions, exceptions and any new amendments must be rechecked before a commercial decision. S02 S03 S04 S06 S21
5. China: Industrial Scale, Listed-Company Investment and the Global Supply-Side Transition
5.1 Why China’s manufacturing base belongs at the center of the outlook
A global packaging transition cannot be analyzed solely through European rulemaking and Western consumer-brand commitments. Production capacity, equipment manufacture, resin compounding, paper conversion, mold tooling, labor productivity and export logistics determine whether a new packaging specification can be delivered reliably and at a tolerable cost. China’s industrial base participates in each of these layers. In 2027, international buyers are likely to encounter Chinese supply not only as finished packaging but also as resins, coated paper, machinery, components and production technology.
Two national indicators establish the scale, while also illustrating how careful the measurement needs to be. China’s National Bureau of Statistics reported 74.87 million tonnes of plastic products manufactured in 2025, a 0.8% decline from the previous year. The series encompasses plastic products broadly; it is not an official count of biodegradable packaging, recycled packaging or exports. Separately, the State Post Bureau reported 198.95 billion express deliveries in 2025, a 13.6% increase from 2024. A parcel count does not directly measure packaging tonnage: one delivery can use different material weights, include reused cartons or involve little secondary wrapping. But it demonstrates the scale at which design changes and packaging-reduction measures must be operationalized. S07 S08
Chinese policy has also moved beyond abstract support for greener materials. Amendments to the Interim Regulations on Express Delivery, effective June 1, 2025, added packaging requirements and stressed green, reduced and reusable packaging, product-package optimization and recovery arrangements. The state standard GB/T 41010-2021, effective June 1, 2022, addresses degradability and identification requirements for biodegradable plastics and products; it is an existing national standard, not a new 2027 rule. Neither instrument proves that every item marketed as biodegradable will degrade in uncontrolled outdoor conditions. S09 S15
The key research question is thus not ‘How much green packaging can China announce?’ It is which parts of its supply chain have moved from project announcements into repeat production, documented sales and verified end-use suitability.
5.2 Kingfa reports production and sales by polymer category
Kingfa Science & Technology (600143.SH) offers a useful financial-reporting example because its 2025 annual report separates production, sales and design capacities. It reported 303,000 tonnes of biodegradable plastics produced in 2025, with 226,300 tonnes sold. Its environmentally oriented high-performance recycled-plastics category recorded 379,000 tonnes produced and 256,300 tonnes sold. The figures are company-reported category totals and cannot be assumed to represent packaging-grade finished products or market consumption of the same amount. S10
Kingfa includes internal use in production and excludes it from the reported sales column. Biodegradable plastics production rose 19.24% year on year and external sales rose 25.37%. High-performance recycled plastics production rose 8.88% while external sales fell 10.35%. The separate capacity table lists 360,000 tonnes of biodegradable plastics design capacity at 84% utilization and 530,000 tonnes of high-performance recycled plastics design capacity at 72%. A buyer should seek grade- and site-specific supply records before drawing conclusions from these category totals. S10
This distinction is important beyond one company. Resin capacity is not finished cup, film or clamshell capacity. Compounders may produce materials for applications outside packaging; internal transfers and inventory movements may affect output-versus-sales comparisons. A market outlook that simply adds the nameplate capacities of every announced PLA, PBAT or PBS project would overstate immediately available, commercially qualified supply.
2027 implication: price competition may intensify in product segments where resin output scales faster than qualified demand, but price direction cannot be asserted without comparable contract data, feedstock costs, grades and utilization. Buyers can ask whether a resin has stable food-contact documentation, conversion history, traceable content and reproducible performance on their equipment.
5.3 Hisun Biomaterials: PLA commercialization does not end at an installed line
Zhejiang Hisun Biomaterials (688203.SH) reported 54,900.38 tonnes of pure PLA produced and 44,787.66 tonnes sold in 2025, up 9.63% and 12.34%, respectively. The report separately records 8,878.16 tonnes of PLA taken for internal use, including production, research and samples. At its Haichuangda project, the first 75,000-tonne-per-year line completed installation and began initial trials in the second half of 2025. The report describes subsequent modifications and formal commissioning as a future step. Buyers should ask for repeat output and shipments at the required grade. S11
The correct reading is neither that the project has failed nor that every tonne of its design capacity was already commercially available. Trial production establishes a different operational stage from sustained qualified output. A resin supplier may need time to stabilize process efficiency, polymer properties, grade consistency and customer conversion approvals. A brand buying compostable cups or film does not necessarily benefit from a production announcement until material can be qualified and supplied repeatedly.
It also matters that PLA is a polymer family with application-specific end-of-life behavior. It is bio-based under many feedstock routes, but commercial compostability claims depend on relevant product construction and certification, not on the letters PLA alone. Heat resistance, sealability, clarity, brittleness, shelf-life needs and actual processing infrastructure create different demand for different PLA grades.
2027 implication: watch the difference between new lines commissioned, repeat sales of qualified resin grades, observed converter adoption and waste-management outcomes. These are four separate milestones.
5.4 YUTO: fiber-based packaging as a diversified industrial business
Shenzhen YUTO Packaging Technology (002831.SZ) reported RMB 1.293 billion in 2025 revenue under its environmentally oriented paper-plastic products category, approximately 7.5% of its total reported revenue, with year-on-year category revenue growth of 1.7%. That figure is a category revenue line, not total paper-and-fiber packaging output and not an environmental impact metric. S12
YUTO’s 2025 report also described research on a dry-process plant-fiber cushioning project, named Ecocoon, which the company positioned as an alternative to some fossil-based protective foams. The filing described laboratory validation and customer testing, with an automated pilot line in planning and construction. That stage is analytically distinct from broad commercial adoption. A technology may have reached meaningful engineering validation without already supplying millions of end-user shipments. S12
The example illustrates why the packaging transition cannot be confined to takeaway food containers. Electronics, industrial protective packaging, cosmetics and e-commerce cushioning face different design tests: compression, impact absorption, moisture response, surface quality, dimensional consistency and packaging-line throughput. Replacing expanded plastic foam with formed fiber could reduce particular plastic uses, but a verified environmental comparison needs the exact product-protection function, mass, energy, shipping volume and disposal scenario.
5.5 Zhongxin: molded-fiber foodservice has real revenue—and ordinary commercial risk
Zhejiang Zhongxin Environmental Protection Technology Group (603091.SH) reported approximately RMB 1.483 billion in 2025 environmental-packaging operating revenue. Its tableware product line accounted for approximately RMB 1.442 billion. Notably, the company’s reporting showed the tableware product line’s revenue fell about 5.0% year over year, while the broader environmental-packaging segment revenue declined about 2.9%. S13
This matters precisely because the company operates in a sector often depicted as an uninterrupted sustainability growth story. A real operating business can face changing prices, export demand, capacity utilization, customer concentration, trade measures and product mix. Commercial success is not guaranteed by alignment with an environmental theme. Revenue alone cannot tell whether physical output grew, whether realized price fell, or how margins moved across sites.
The company also disclosed overseas operations, including a Thai plant that the company says began production in April 2025. The operating site illustrates geographic diversification. The filing does not quantify any tariff benefit or transfer of production share. Country of origin, substantial transformation and applicable trade measures have to be checked for each export arrangement. S13
2027 implication: molded fiber is already an industrially developed category, not merely a laboratory alternative. The unanswered question is where it can meet food-contact, grease, moisture, heat, delivery and recovery requirements at a commercially acceptable cost without overstating compostability or recyclability.
5.6 Xianhe: paper and food-board scale requires category discipline
Xianhe Corporation (603733.SH) reported 369,500 tonnes produced and 335,700 tonnes sold in its food and medical consumer materials category in 2025. Sales volume rose 34.36% year on year. The broader category includes more than food packaging. A separate passage describes market rollout after upgrades to a 300,000-tonne food paperboard line. That line figure describes its scale, while the production and sales figures cover the broader category. Buyers need product-level availability for the specific grade. S14
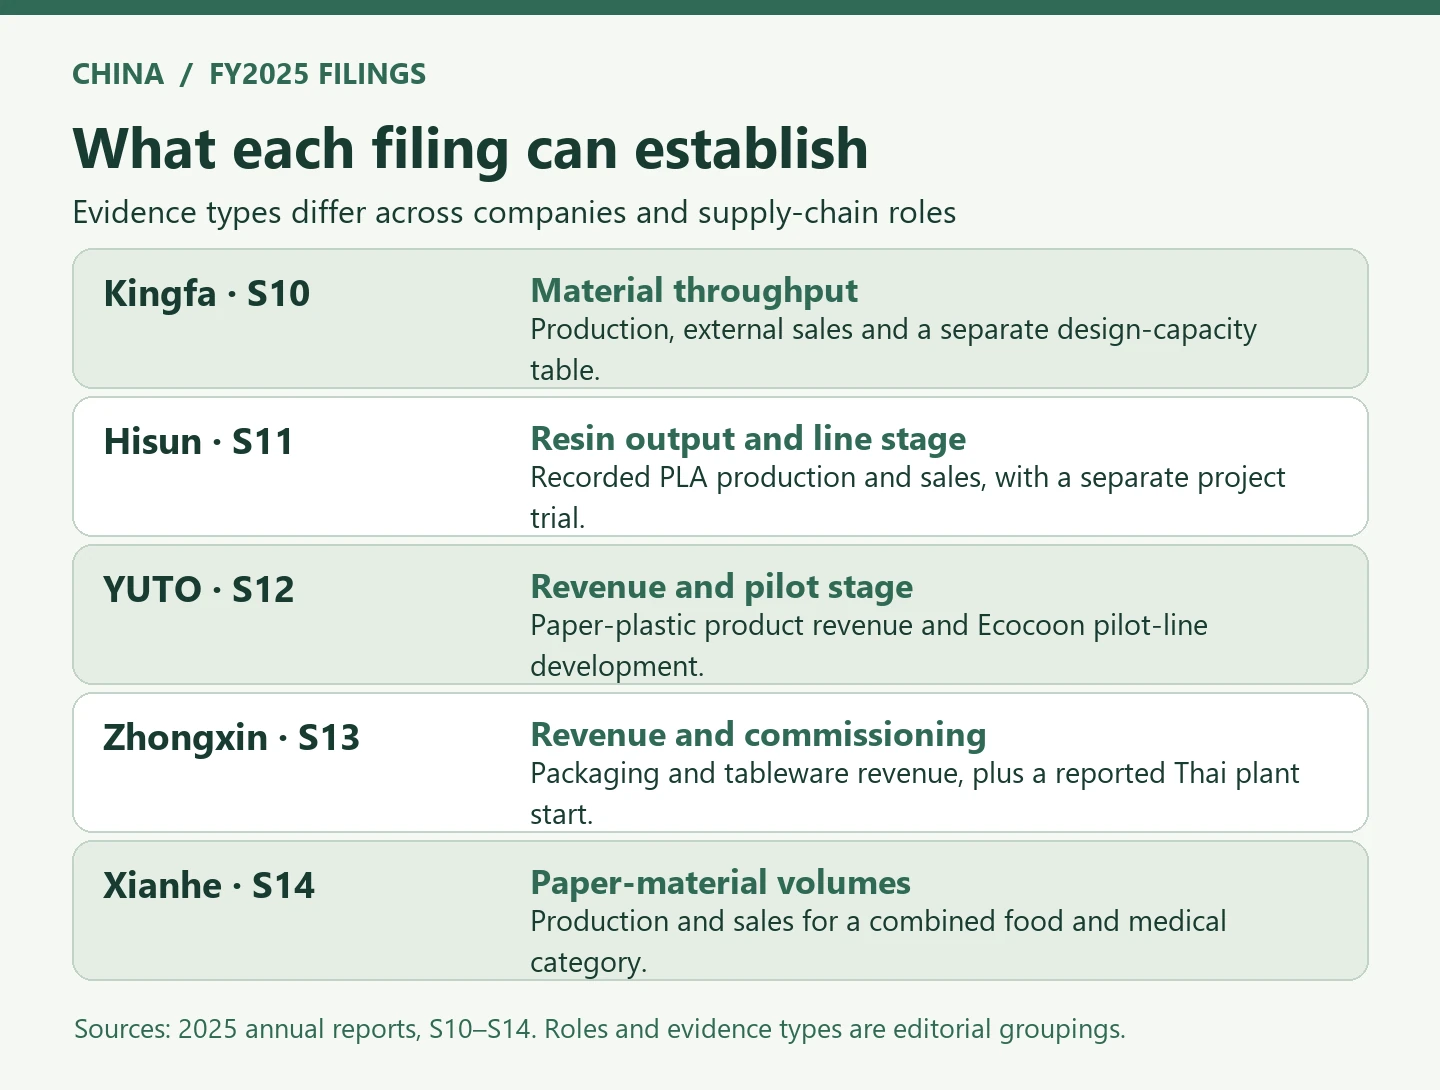
This is an example of the importance of material supply upstream of finished packages. Food-grade board performance depends on base paper, forming behavior, coating, print compatibility, surface properties, compliance and converter waste. ‘Paper’ is a family of constructions with very different recyclability prospects. A high-volume board mill and a converter selling finished bowls have different roles and neither role alone proves what happens after consumers discard the final item.
5.7 Bioleader illustrates finished-goods conversion
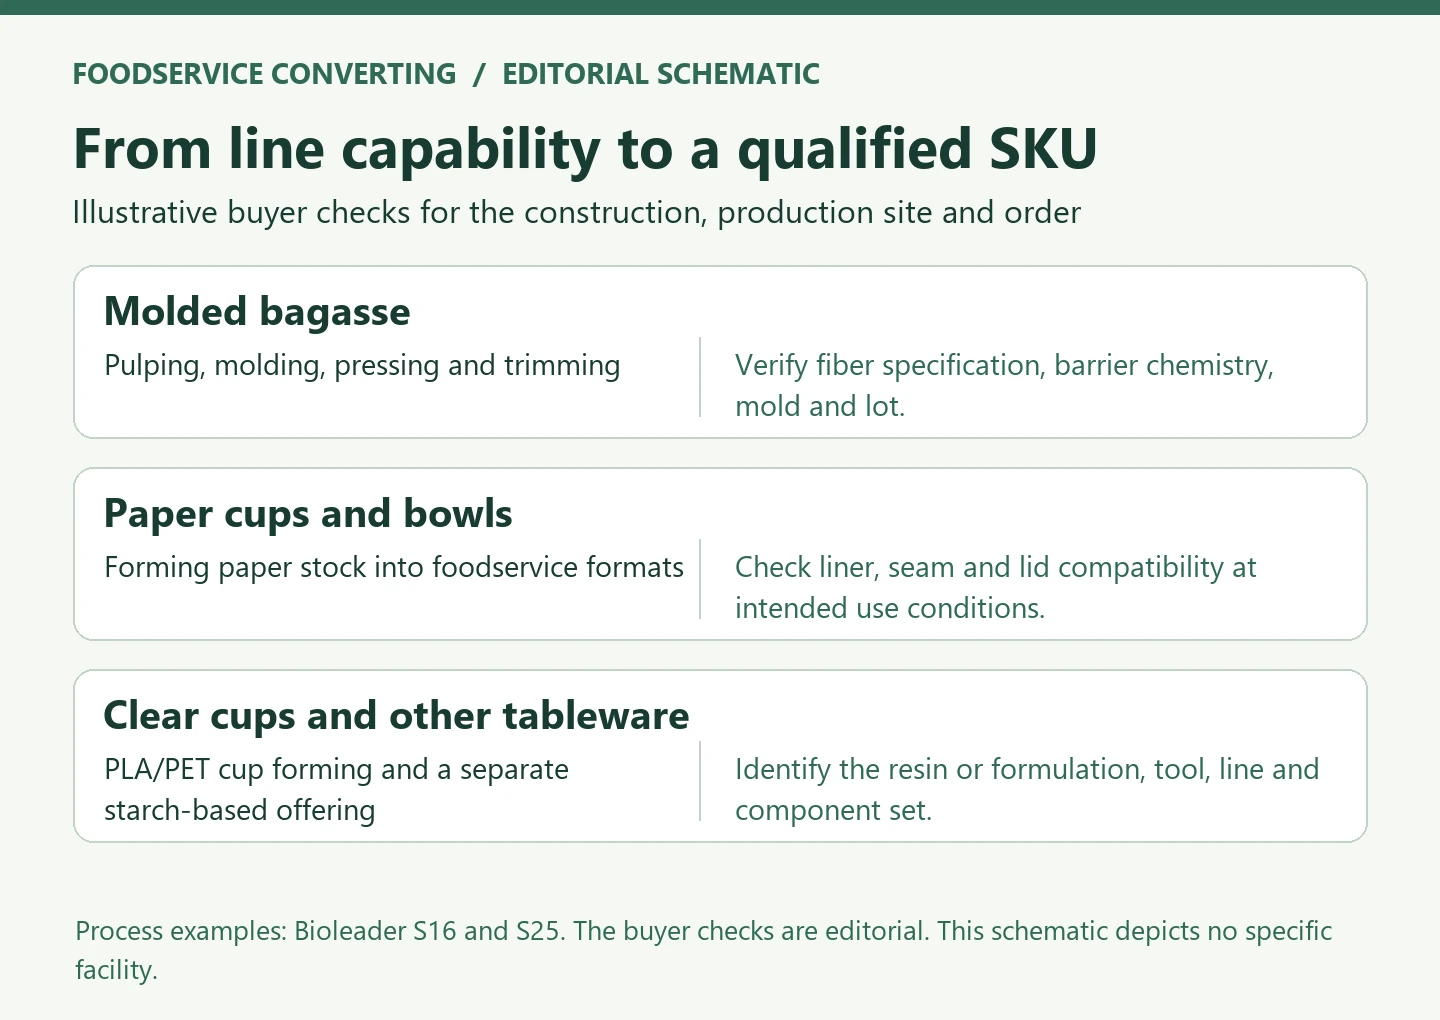
Bioleader, a Xiamen-based manufacturer and export supplier, converts fiber, paper and polymers into finished foodservice packaging. Its reported portfolio includes molded bagasse containers and tableware, paper cups and bowls, starch-based tableware, cutlery and clear beverage cups. For importers, this range puts several different production and qualification processes under one supplier relationship. S16
For bagasse, the company describes pulping, vacuum molding, hot pressing and trimming. Its profile and FAQ label 30,000+ tons per year as bagasse production capacity. Elsewhere, the profile describes the same figure as annual output without specifying a reporting period. This report records the capacity label in the company’s own unit. Dated production records would be needed to establish actual output. S16
The company describes forming lines for paper cups and bowls and lists constructions with aqueous coatings and PLA linings. It also reports extrusion, thermoforming and injection molding across parts of its plastics and starch-based offering. A separate manufacturing announcement gives a ceiling of up to 40 million PLA and PET cups combined per month. The two figures describe different product lines and use different units and periods. They cannot be added. Both come from the manufacturer, and neither establishes audited production, line utilization or sales. S16 S25
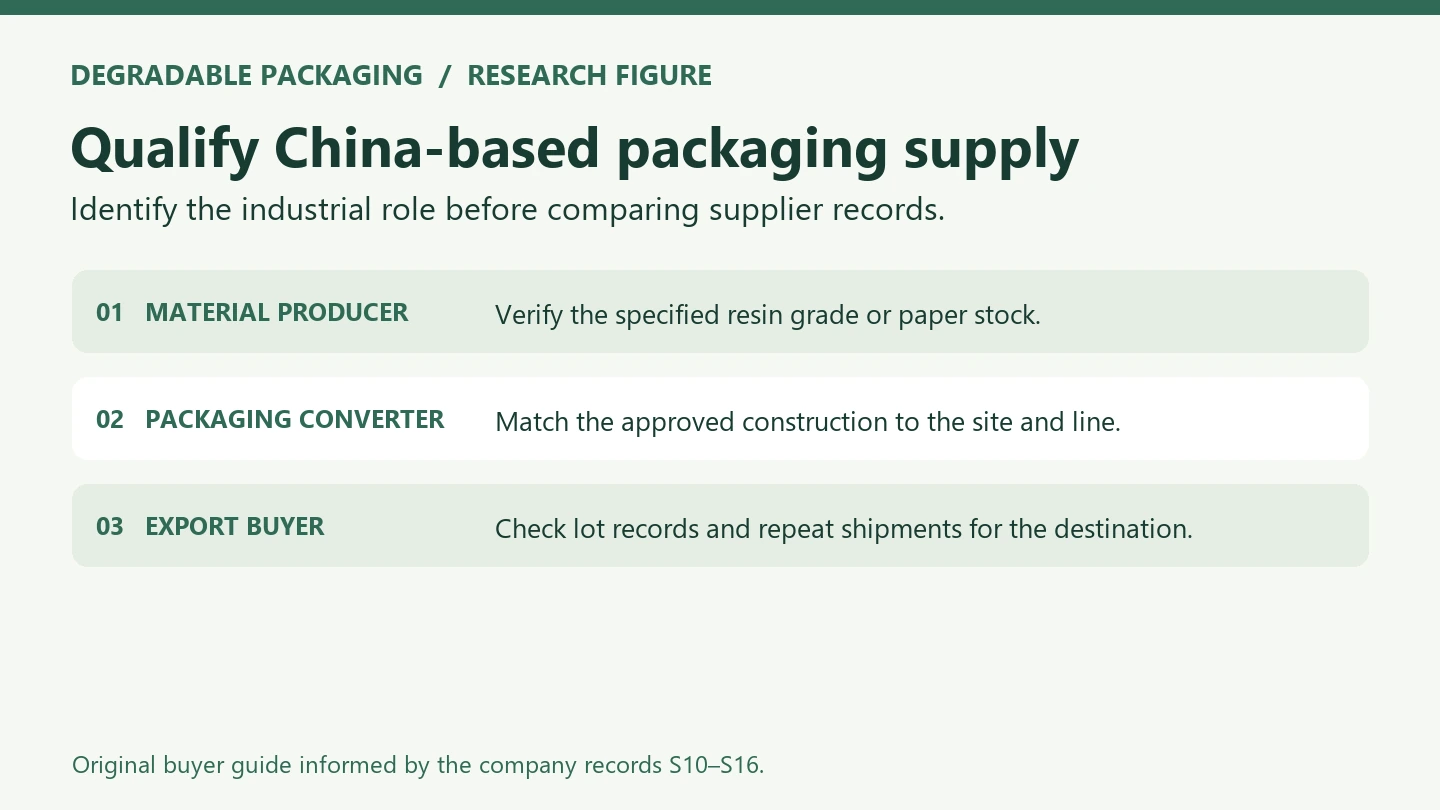
A buyer comparing these formats should identify the factory, line, tooling and exact material specification for each ordered SKU. For example, the barrier and seam matter for a paper cup, while resin identity and lid compatibility matter for a clear cup. A bill of materials, incoming-material records, lot-level output and inspection records, test reports for the intended use, and a history of accepted shipments can help establish whether the qualified construction can be supplied consistently to the destination market.
China industrial evidence table: different measurements, different interpretations
| Company and source | Disclosed measure or stage | What the record establishes | Buyer evidence still needed |
|---|---|---|---|
| Kingfa (600143.SH) S10 | Biodegradable plastics: 303,000 t produced, 226,300 t sold. High-performance recycled plastics: 379,000 t produced, 256,300 t sold. | 2025 production includes internal use. Sales exclude internal use. The separate design-capacity table measures potential output. | Grade, facility, qualified volume and recurring sales. |
| Hisun (688203.SH) S11 | 54,900.38 t pure PLA produced, 44,787.66 t sold. The 75,000 t/year first project phase began trials in 2025. | Recorded annual volumes and separate project-stage disclosure. | Repeat production and shipments from the line at the ordered grade. |
| YUTO (002831.SZ) S12 | RMB 1.293bn paper-plastic products revenue, up 1.70%. Ecocoon was at automated pilot-line planning and construction. | Commercial revenue for a broad reporting category and a separate R&D project milestone. | Commercial run data and protective performance of the exact design. |
| Zhongxin (603091.SH) S13 | RMB 1.483bn environmental packaging revenue, down 2.91%. RMB 1.442bn tableware revenue, down 4.97%. | Company-reported revenue. The two categories overlap. The filing also reports an April 2025 Thai plant start. | Site-specific capacity, output, origin and product records. |
| Xianhe (603733.SH) S14 | 369,500 t produced and 335,700 t sold in food and medical consumer materials. Sales volume up 34.36%. | Reported volume for a combined paper-material category. | Grade-level availability and qualification, separately from line scale. |
| Bioleader S16 S25 | 30,000+ tons/year bagasse capacity as labeled. Up to 40 million PLA/PET cups combined per month. | Manufacturer capacity claims for two lines, using different units. | Actual output, utilization, shipments and SKU qualification. |
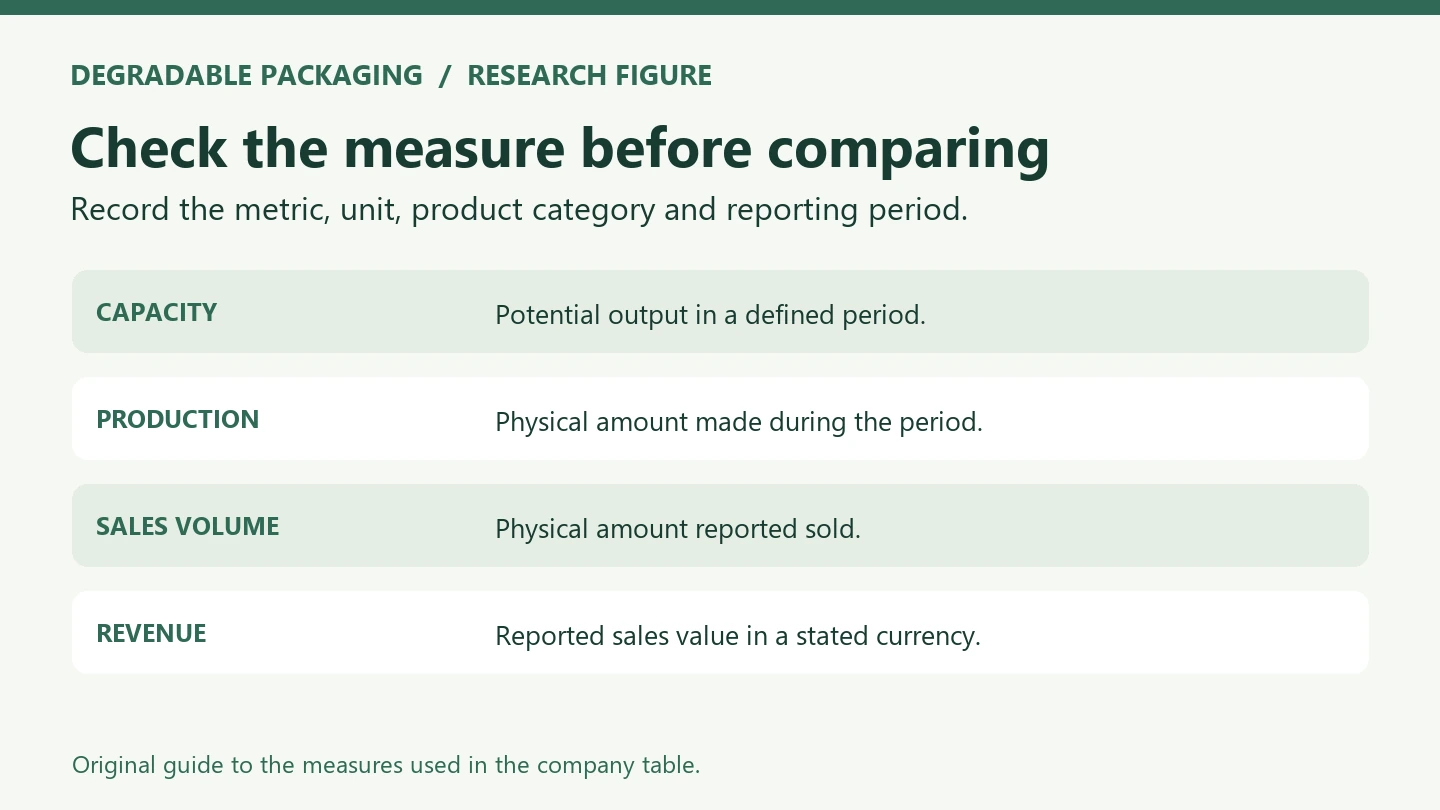
Source basis: five 2025 listed-company annual reports and Bioleader’s manufacturer disclosures. Quantities, currency values and development stages are deliberately not combined into a single market share or capacity total. S10 S11 S12 S13 S14 S16 S25
5.8 What Chinese industrial expansion does—and does not—mean for the world
China’s contribution spans upstream polymer production, paper and pulp supplies, molded-fiber equipment, converting operations and international distribution. It also includes growing operational pressure to reduce material use in enormous domestic logistics systems. The State Post Bureau has reported progress on standardized parcels, reuse and recovery measures; these are official sector disclosures with their own measurement methods, not a complete lifecycle account of all parcel packaging. S08 S22
For 2027, four forces could change the competitive landscape. First, added material capacity could reduce sourcing constraints for qualified grades, though not necessarily for every finished product. Second, supplier diversification within and beyond China may improve delivery resilience while complicating origin and documentation checks. Third, industrial investment can accelerate scale-up of particular fiber and polymer processes if customers qualify the products. Fourth, competitive pressure could expose the difference between headline output and sustainable margins.
The important question is not whether China can manufacture enormous volumes—it can. The question is which materials, components and production methods will be consistently qualified, commercially absorbed, correctly documented and suitable for the recovery systems of their end markets. That remains open, and the answers will vary across packaging categories.
6. Materials: Beyond ‘Plastic Versus Paper’
6.1 Fiber-based packaging needs functional and end-of-life specificity
See our analysis of paper food-packaging barrier systems for the role of coatings, seams and process conditions.
Fiber-based packaging brings established manufacturing know-how, familiar feedstocks and applications ranging from corrugated transport cases to rigid molded trays. In foodservice, molded pulp, bagasse, paperboard and various coated constructions are increasingly considered as alternatives to particular plastic formats. The key engineering question is not whether the raw fiber came from a plant. It is whether the finished construction protects the product, withstands the intended conditions, meets chemical and food-contact requirements and fits a viable recovery route.
An uncoated paper transit sleeve and a grease-resistant, wet-strength takeaway box are different waste-management propositions. Barrier performance may require internal sizing, dispersions, laminations or treatments that change the way fibers separate during recycling, the level of screening rejects and the possibility of composting. Product geometry also matters: a formed tray that fails when hot or wet may create food waste or require an added liner, reversing part of the expected material benefit. The same package may be suitable for one type of meal and inappropriate for another.
For 2027, converters should report performance by test condition—food type, temperature, duration, coating construction, print and lid—not by fiber name alone. Where recyclable claims are made, the relevant paper recycling process and likely collection stream should be specified. Where compostability is claimed, the relevant certification scope and operational composting access are separate questions. Fiber substitution is strongest when the entire package works without relying on unexamined assumptions about its disposal.
6.2 Conventional plastics are changing through design and recycled content
An evidence-based report cannot treat all conventional plastics as an undifferentiated environmental failure. A durable reusable polypropylene tote, a tightly specified PET beverage bottle and a composite flexible food pouch perform different functions and have different waste systems. The more meaningful plastics trend is targeted redesign: removing problematic components, simplifying material combinations, increasing recoverable content where qualified, and improving actual use of collected material.
Mono-material approaches can help some recycling systems, but the term is not a recycling guarantee. Printing, adhesives, closures, additives, labels, metallization and food contamination may affect real collection and reprocessing. Recycled content is likewise separate from post-consumer recyclability. A package may contain recycled feedstock yet remain difficult to recycle after use; another may be technically recyclable but contain no recycled input.
For food-contact applications, recycled content can bring additional legal and processing constraints. Suppliers need to establish whether the material, recycling process and intended contact conditions are authorized or otherwise compliant in the destination jurisdiction. Recycled-content chain-of-custody evidence needs to be consistent with the exact claim: mechanically recycled content in a bottle, mass-balanced chemical feedstock allocation, and recycled packaging components are not interchangeable without clearly defined accounting rules.
6.3 PLA, PBAT, PHA and other bio-based polymers need distinct assessments
The label bioplastic obscures several distinctions. A polymer can be bio-based but not biodegradable under a claimed environment, fossil-based yet biodegradable under specified conditions, or neither. PLA is used in certain clear rigid applications, films and other products, but compostability of a PLA-containing finished item depends on its construction, relevant standard and waste-processing conditions. PBAT is often used in compostable blends but should not be described as automatically bio-based. PHA comprises several related polymers with different properties and possible degradation pathways; commercial performance depends on grade and application.
The industrial opportunity is real, as Chinese resin production demonstrates. But a credible 2027 outlook must separate polymer capability from finished packaging feasibility. A buyer of compostable bags may need tear performance, seal strength and shelf-life behavior that differ from a buyer of rigid foodservice cups. A supplier of hot-food boxes faces different moisture, temperature and grease conditions again. Changes to thickness, coatings, ink, color or additives can alter final compliance and end-of-life outcomes.
The Commission for Environmental Cooperation published a 2026 pilot-scale study of certified compostable poly-coated fiber food packaging at two North American composting facilities. The study was designed to examine processing, disintegration, operations and compost-quality effects under two composting methods. Its existence is important because it asks the question at operating-facility level, but a two-site pilot cannot be used to declare that all such packaging is accepted or effectively processed by all composters. S17
2027 implication: the strongest adoption cases will identify a genuine waste-management advantage or a specific functional need, rather than assuming that ‘plant-based’ has the same meaning as ‘sustainable’ in every market.
6.4 Emerging barriers and novel feedstocks: readiness should be staged
New barrier chemistries, cellulose-derived films, seaweed-based concepts and alternative fiber feedstocks frequently attract attention because of their potential to reduce dependence on particular polymers or chemicals. But publicity commonly compresses several development stages into one word: commercial. A laboratory coupon, converter trial, customer qualification batch, installed production line and repeat annual sales are not equivalent.
The meaningful questions are more demanding than a successful demonstration: What is the coating weight? Does performance persist after printing and forming? Are water vapor and oxygen barrier requirements measured by comparable methods? How does the coating behave under actual food contact? Can the line run at normal commercial speed and yield? Are costs still competitive after downtime, rejects, energy, chemicals and licensing are included? What will happen when the package reaches the actual local recovery facility?
A claimed breakthrough without these answers remains an emerging signal, not an established sustainability solution. This should not discourage research; it should protect credible research from overstatement.
Material evidence and commercialization matrix
| Material or system | Commercial stage and basis | Decisive evidence gap | 2027 interpretation |
|---|---|---|---|
| Corrugated and uncoated paper | Established production for many formats. Recovery depends on an operating fiber stream. | Collection quality, contamination and local route. | Assess package and destination together. |
| Coated paper and molded fiber | Commercial conversion for selected uses. The CEC coated-fiber study is a two-facility pilot of recovery. S13 S17 | Barrier chemistry, mill or composter acceptance and finished-item tests. | Commercial availability and recovery maturity can differ. |
| PET, PP and PE designs | Established conversion. Recycling compatibility varies by grade, format and components. S03 | Component compatibility, yields and end markets. | Verify the applicable collection and assessment route. |
| Recycled-content polymers | Commercial in defined grades. Kingfa reports actual recycled polymer sales. S10 | Chain of custody, qualified content, food-contact scope where relevant, consistency and price. | Ask for grade- and order-level evidence. |
| PLA and compostable blends | Existing commercial PLA resin sales. Hisun’s new line reached an initial trial in 2025. S11 | Repeat supply for the chosen grade, finished-item certification and local organics acceptance. | Separate material supply from project readiness and recovery. |
| PHA and emerging bio-based polymers | Stage varies by resin grade and application. This report does not establish broad qualified supply. | Repeat runs, independent tests and customer acceptance. | Classify the exact grade as trial, limited commercial or established using direct records. |
| Reusable packaging | Commercial in some closed loops. Reported adoption across brand and retail signatories remains limited. S20 | Achieved cycles, return rate, washing, transport and losses. | Qualify the operating loop and track actual trips. |
These qualitative assessments are editorial classifications, not comparative lifecycle rankings or a numerical index.
7. Circularity in Practice: The Infrastructure Test
7.1 Recyclability is a chain of operations
A claim of recyclability can fail at any step. Collection systems may not accept the item. Optical or mechanical sorting may misidentify a small or multi-material format. Reprocessors may lack an economic reason to handle it. Yield losses may make processing expensive. Recovered material may not meet an end user’s specifications. This is why the UK RAM 2027 framework is useful beyond its own jurisdiction: its four-stage logic—collection, sortation, reprocessing and application—offers a disciplined way to ask what happens in practice, without making its legal rating transferable to other countries. S03
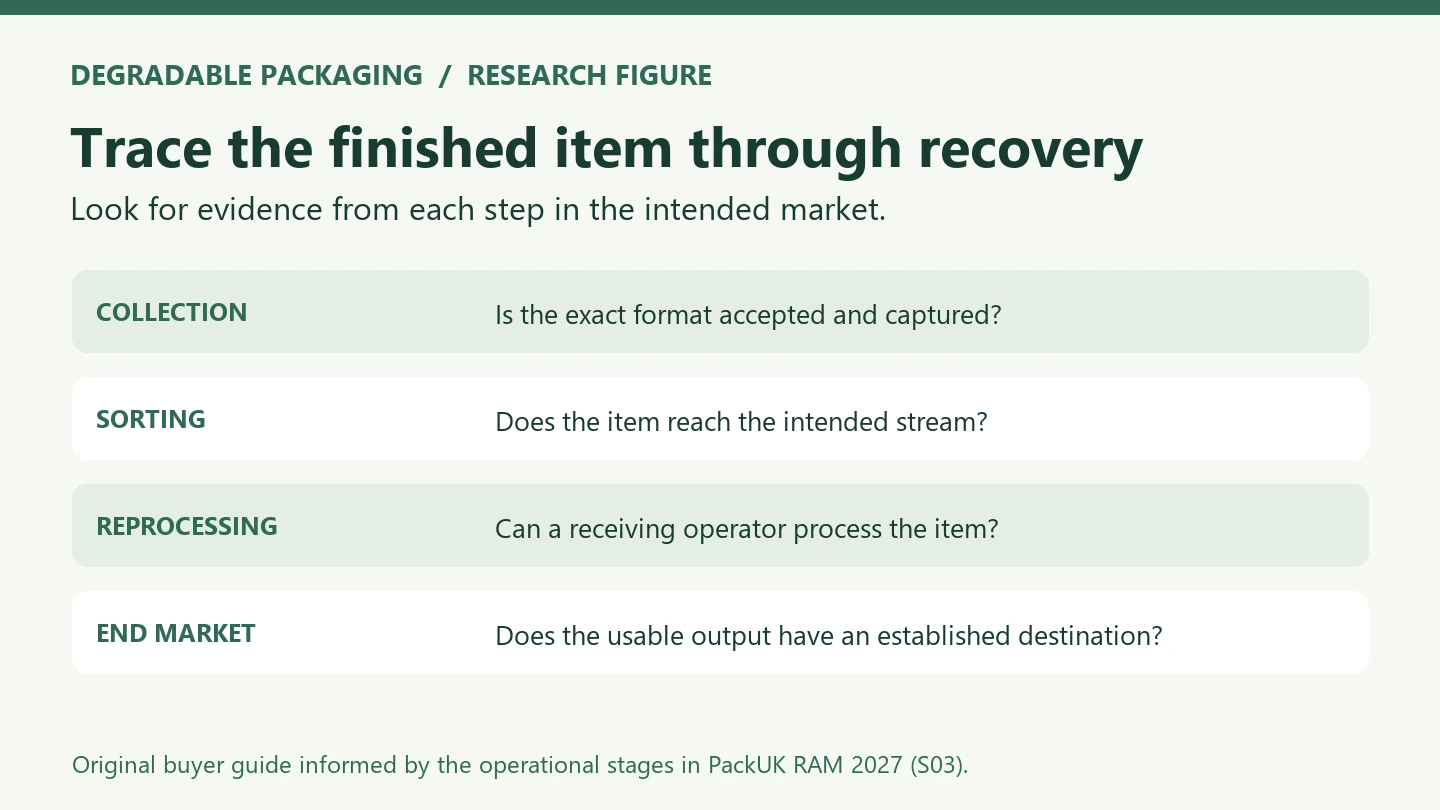
Collection access is often the starting point rather than the endpoint of the evidence chain. Reprocessing claims should identify the relevant material and process. If a company says a package can be repulped, it should explain what was tested: a lab specimen, a commercial mill trial, or a documented operational recovery route. A result from one paper mill does not establish universal recyclability across all markets.
The choice between recycled input and future recyclability also creates tension. Recycled-content specifications are useful, but they must not become a reason to overlook waste prevention or packaging functionality. A package using a higher recycled share may be a good choice under one evaluation and inferior under another if it requires substantially more mass, fails more often, or cannot be safely used for the intended product. The trade-off must be assessed rather than assumed.
7.2 Composting is a managed waste-system decision
The distinction between industrial and home composting matters when qualifying a finished item for a specific collection route.
Certified compostability can tell buyers that a defined product met specified test criteria. It does not mean the package will quickly disappear in soil, freshwater or the open ocean. Industrial composting and home composting are different claims. Commercial operators may reject products for contamination, visual similarity to conventional plastics, residence time or screening reasons even where a relevant certification exists. A certification for a raw resin cannot automatically be generalized to an assembled printed package and lid.
The CEC’s August 2026 work on coated fiber packaging illustrates why field-level testing is valuable. Tests conducted under defined composting methods can reveal interactions that a material label cannot. But buyers also need to know the service area, collection rules and operator acceptance where the item will be used. A municipality or private composter can change accepted materials. S17
An appropriate 2027 buyer question is therefore not only, ‘Is it certified compostable?’ It is, ‘What is certified, under which program and version, and where will this specific item actually be collected and processed?’ The answer may be different for a campus with separated food waste, a city with limited organics collection and a region relying on landfill disposal.
7.3 Reuse is an operating model, not a product attribute
Reusable packaging can be environmentally and economically attractive when it achieves sufficient repeat cycles, retains product quality and operates with efficient return and cleaning. A container that is strong enough for 100 uses does not deliver 100 uses unless the return system makes that happen. The system must manage reverse logistics, retrieval incentives, cleaning and inspection, inventory losses and consumer behavior.
The Ellen MacArthur Foundation’s signatory disclosures show that reuse has not scaled as quickly as some design-for-recycling indicators. That finding should not be interpreted as proof that reuse is inherently impractical. It indicates that its operational and commercial dependencies remain substantial. S20
The decisive financial metric is often cost per successful service, not the purchase price of the reusable container. If a reusable box costs more but completes many trips with low loss and short return distance, its cost per trip may fall. If it is lost after a few rotations or requires long-distance cleaning, the economics can reverse. Environmental comparisons likewise require system boundaries that include washing, collection, energy, material production and avoided single-use items. Where product loss or contamination differs, that difference belongs in the assessment.
7.4 The hierarchy begins with prevention
UNEP’s Turning off the Tap report emphasized systems change through removing unnecessary plastic uses, reorienting and diversifying, reuse and recycling. Its scenarios are conditional modeled outcomes, not proof that a particular global waste reduction has already occurred. The underlying logic matters: a recycling system cannot by itself compensate indefinitely for all growth in avoidable packaging use. S19
For a manufacturer, prevention may look operational rather than dramatic: fewer nested cartons, better package dimensions, lower trim loss, reduction of redundant components, better load density and more efficient secondary packaging. For a brand, it may mean delivery formats that require less protection or more accurate packaging-to-product matching. These decisions can yield environmental and cost benefits, but only if they preserve the service the package was designed to deliver.
8. Claims, PFAS and Certification: Verification Becomes a Purchasing Function
8.1 A credible claim describes an attribute, not an identity
‘Green’, ‘planet-friendly’ and ‘sustainable’ are broad descriptions that often omit the necessary basis of comparison. More useful claims are narrow: a specified post-consumer recycled-content percentage under a defined chain-of-custody system; an identified product certified to a named compostability scheme; a tested grease-resistance result at stated temperature and time; or a recyclability assessment for a specified jurisdiction and packaging construction. Even these require limitations.
The EU’s consumer green-transition rules reinforce scrutiny of vague environmental language, while PPWR adds detailed packaging-related obligations. These regimes should not be collapsed into a generic worldwide ban on environmental marketing. Their jurisdiction, actor, claim type and date determine the actual duty. S02 S06
8.2 Why a certificate should trigger questions, not end them
A mill-level certificate, factory management-system certificate, finished-product test report, transaction certificate and declaration of conformity answer different questions. For recycled material, a claim about the content in a particular shipment may require transaction records or scheme-specific allocation evidence, not just proof that the supplier operates a certified facility. For compostability, a raw-material certificate may not cover the converted item with printing, coatings, colorants and accessories. For food contact, a test performed for one food type, temperature and duration may not establish suitability for every application.
Buyers should check the holder, issuing organization, certificate number, validity date, product description, manufacturing location, applicable standard version, scope, exclusions and link between the certified object and the purchase order. They should preserve document versions and specify how changes to coating, material source or design are communicated.
8.3 PFAS claims require chemical and analytical precision
PFAS-free claims are particularly sensitive because ‘no intentionally added PFAS’, ‘non-detect’, ‘below a reporting limit’ and ‘compliant with a particular legal threshold’ are not synonyms. A laboratory method may target a defined list of substances rather than all potential PFAS. A reported non-detect result depends on detection and quantification limits. Some regulatory definitions and analytical approaches treat polymeric and nonpolymeric substances differently. S23
For food-contact packaging placed on the EU market under PPWR’s Article 5(5), the legal question is compliance with the specified thresholds and associated definitions, not whether a supplier has used the marketing phrase ‘PFAS-free’. Buyers need current, product-specific records and should have a clear escalation process when tests disagree or the construction changes. This report does not purport to decide the compliance status of any named supplier’s product. S02 S23
8.4 The RFQ evidence checklist
| Claim or specification | Minimum useful buyer request | Common scope gap |
|---|---|---|
| Recycled content | Percentage basis, material and component coverage, verified chain of custody, shipment/lot connection | Recycled-content evidence covers the main packaging component but excludes the lid, liner or other components. |
| Recyclable in destination market | Entire-pack construction, collection/sorting/reprocessing evidence, market-specific route | Raw material recyclable; assembled package not accepted |
| Compostable | Exact scheme, standard edition, complete-item coverage and current certificate | Resin certified; printing, barrier or lid outside scope |
| PFAS-related | Intended-use statement, substance definition, test method, detection/reporting limits, specimen | ‘Free’ asserted from a narrow or outdated test |
| Food contact | Declaration/test appropriate to jurisdiction, food type, time, temperature, whole construction | Cup tested but matching lid or coating unexamined |
| Reusable | Achieved rotations, return and loss rates, cleaning process and service assumptions | Durability claim presented as realized reuse |
| Material performance | Relevant barrier, heat, mechanical and sealing tests under stated conditions | Laboratory specimen treated as commercial production result |
The checklist is a procurement framework, not a claim that every listed document is legally mandatory in every market.
9. The Economics: A Lower Unit Price Can Be a Higher System Cost
9.1 Comparing packaging by the service it provides
The useful functional unit is rarely ‘one package’ in isolation. For takeout, the buyer may need one safe, leak-resistant meal delivery over a defined time and temperature. For e-commerce, the unit is the successful arrival of an undamaged product. For a reusable transport box, it may be one completed logistics trip. A material that appears expensive per unit may reduce product damage, improve packing density or lower disposal costs. A cheaper unit may create rework or claims risk. Without a common service definition, a price comparison is not evidence of efficiency.
A comprehensive landed or lifecycle-cost assessment can include material price, converting yield, print setup, molds and tooling, minimum orders, quality failures, freight and dimensional weight, warehousing, compliance documentation, extended producer responsibility charges and disposal. Not every cost is material in every case. An export distributor with long transit times has a different profile from a local closed-loop reuse operator.
9.2 EPR may expose costs previously treated as external
Producer responsibility is not simply another administrative form. Depending on the jurisdiction and implementation, it can change the way design decisions influence compliance expense and downstream recovery funding. But an EPR charge should not be assumed to be identical across markets, and future fee levels should not be invented where schedules remain under development. The stronger 2027 message is methodological: firms need cost models that can be updated when packaging ratings and producer obligations are confirmed. S03 S04 S05
9.3 Capacity growth does not automatically create affordable qualified supply
China’s listed-company disclosures show why price forecasts based only on headline factory size are weak. A firm may report high design capacity but lower utilization; a project may be in trial production rather than stable operations; a product category may show lower sales even when a larger industry narrative suggests growth. Technology qualification, order mix, raw materials, equipment uptime, export access and financing all affect realized cost. S10 S11 S12 S13 S14
Buyers evaluating a new resin or molded-fiber construction should ask for repeated production data, not only a sample and a plant-opening announcement. Where new capacity is expected to lower pricing, the claim should be supported by comparable contracts or observed price data. This report does not forecast specific 2027 PLA, PBAT, fiber or recycled PET prices because a cross-market, specification-aligned price series has not been established here.
9.4 A decision matrix for packaging procurement
| Procurement question | What to measure | Why it may change the decision |
|---|---|---|
| Does the pack protect the product? | Leakage, damage, contamination, shelf-life and returns | Product loss can dominate small material savings |
| Is the claimed environmental route real? | Collection access, acceptance, effective reprocessing or achieved reuse | Technical design alone may not deliver an outcome |
| Is supply proven? | Qualified shipments, lot consistency, operating output, change control | Announcement is not availability |
| What is the full cost? | Landed cost, yield, tooling, freight, EPR and handling | Lowest quote may not be lowest cost per service |
| Can the claim survive scrutiny? | Product-specific documents, test methods, certificate and legal scope | Unsupported wording creates compliance and reputation exposure |
10. Regional Comparison: One Transition, Different Systems
European Union. The PPWR creates a relatively coherent regulatory frame, but detailed implementation dates, technical provisions and market practices still matter. EU waste data show both meaningful collection and recycling activity and persistent growth pressures. For suppliers, documentation and package-level design decisions are increasingly central. S01 S02
United Kingdom. The 2027 RAM provides a concrete incentive to understand operational recyclability by component and material category. Packaging producers and their suppliers should not treat recyclable-looking designs as sufficient evidence without considering the existing recovery system. S03
United States. State programs are advancing through different legal frameworks and implementation stages. California and Oregon illustrate this variety. National buyers will need a map of applicable responsibilities rather than a single US ‘compliant package’ label. S04 S05
China. The combination of huge industrial output, express-delivery volumes, listed-company investment and export-oriented converting makes the country indispensable to packaging technology and supply decisions. Its importance should not be measured only by biodegradable resin announcements; established paper, plastics, equipment and logistics capabilities are equally consequential. S07 S08 S09 S10 S11 S12 S13 S14 S15 S16
Local verification. In markets with limited published recovery data, request the municipal collection list and the destination facility’s acceptance criteria. Record which exact construction the facility accepts and under which operating conditions.
The report does not rank regions by a synthetic sustainability score. Different metrics—waste statistics, production output, legal readiness and recycling collection—cannot simply be merged into one authoritative league table.
11. Three Conditional Scenarios for 2027–2030
Scenario A: Accelerated evidence-led circularity
Under this scenario, policy implementation proceeds broadly as scheduled, collection and reprocessing investment grows, and more brands make product-level data a standard purchasing requirement. Fiber, recycled-content polymers, reuse and compostable applications would each expand where there is a compelling application and recovery fit. Successful suppliers would compete on both environmental evidence and operating reliability. Signals to watch: implementation milestones, verified recovery capacity, supplier qualification results, repeated orders and audited recovery outcomes.
This is not a forecast that recycling rates must rise by a particular percentage. It is a description of the conditions that would make a faster transition plausible.
Scenario B: Uneven, region-specific progress
This may be the most useful working scenario for multinational buyers. Regulations and collection systems advance at different speeds. A packaging design accepted in one jurisdiction needs modifications or different documentation in another. International suppliers develop multiple constructions—different coatings, material mixes or labeling—around different markets. The cost of managing specifications grows, but firms that maintain clear material and compliance records can respond faster. Signals to watch: diverging official rules, different recovery acceptance lists, multiple packaging bills of materials and increased market-specific testing.
This scenario is consistent with current institutional fragmentation but is still a forward-looking interpretation, not an observed outcome for 2027.
Scenario C: Cost, infrastructure and qualification bottlenecks
In this scenario, policy ambition is not matched by sufficient infrastructure or affordable production. Some new bioplastics or barrier technologies struggle to meet commercial cost and quality requirements. Reuse systems show lower-than-planned return cycles. Recovered-material markets experience weak demand or inconsistent quality. Buyers continue to redesign packaging but favor material reduction, proven conventional recycling streams and improvements in packaging efficiency over unverified alternatives. Signals to watch: unused announced capacity, persistent qualification delays, recycling-facility constraints, documented losses and weak realized demand.
A slowdown would not disprove the environmental need for better packaging. It would demonstrate the difference between a desirable technical end state and the economics of reaching it.
Scenario comparison
| Observation and source | Accelerated transition | Uneven transition | Bottleneck scenario |
|---|---|---|---|
| Implementation: dated regulator actions and plan decisions S02 S03 S04 | Milestones proceed and usable guidance appears in several markets. | Dates and guidance diverge between markets. | Recurring deferrals or unresolved rules delay qualification. |
| Recovery: comparable official waste series and operator output records S01 S03 | Operators report usable output gains across multiple formats. | Collection or usable output improves only in selected systems. | Design changes expand while verified output lags. |
| Supply: annual reports and repeat commercial shipment records S10 S11 S12 | Pilots progress to stable grade-specific deliveries. | Qualified supply improves selectively by grade and destination. | Trials persist or reported additions fail to translate into repeat supply. |
| Reuse: realized returns, trips and losses from operators S20 | Multiple loops achieve planned cycles with stable losses. | Targets are met mainly in closed or dense loops. | Loss and logistics prevent target cycles. |
| Evidence that weakens the scenario | Parallel delays or stalled recovery output across markets. | Verified progress or stagnation converges across markets. | Repeat qualified supply, verified recovery growth and stable returns recur across systems. |
These are editorial scenarios, with no assigned probabilities. They should be revisited as 2027 evidence becomes available.
12. What Packaging Stakeholders Should Do in 2027
Worked example. A buyer evaluating the same coated paper cup for UK households and a venue with separate organics collection can begin with one construction record, including the cup wall, barrier and lid. For the UK assessment, the producer checks PackUK’s classification and materials guidance. For the venue, the buyer confirms whether the contracted composter accepts that exact cup and whether the venue can collect it separately. The buying decision can differ even with an identical specification. If either route lacks evidence, keep that destination’s recovery claim on hold while separately evaluating whether the cup meets its functional requirements. S03 S17
Brand owners should inventory packaging by exact construction and destination—not just material family. Identify which packages face immediate legal obligations, which are covered by later milestones and where supplier claims lack component-level documentation. Include actual product protection and available recovery routes in redesign decisions.
Manufacturers and converters should build records that tie production lots to bills of materials, coatings, inks, sourcing and relevant test versions. Report commercial readiness in stages: development, qualification, installed capacity, operating output and repeat sales. Avoid equating a resin supplier’s certificate with automatic approval of the final converted product.
Procurement teams should specify use cases first. Compare suppliers on consistent performance tests, traceable material claims, change controls, supply reliability and cost per delivered service. Where a sustainability claim matters commercially, ask exactly what the evidence covers and what happens if the product or source changes.
Regulators and recovery operators should make material acceptance and method definitions as clear as possible. Where real-world recovery is an evaluation criterion, transparent information on collection, sorting, yields and markets for recyclate makes better design and buying decisions possible.
Investors and analysts should test whether a sustainability-themed business has progressed from announced capacity to effective operating output and sales. Distinguish revenue growth from physical volume, utilization from design capacity, and future planned projects from completed commissioning.
13. Final Outlook: The Sustainable Package Must Work as a System
The strongest 2027 packaging sustainability trend is a change in the burden of proof. Brands and suppliers can no longer rely on the assumption that a familiar environmental label answers the important questions. A credible package must work for the product, meet the applicable legal requirements, have accurately scoped evidence and fit the infrastructure available where it will be used and discarded or returned.
This outlook does not suggest that material innovation is unimportant. On the contrary, China’s expanding industrial capabilities, the maturation of fiber and polymer technologies, and evolving recovery systems create real opportunities. But better materials and larger factories do not automatically produce better environmental outcomes. Performance is determined by a sequence of design, manufacturing, logistics, use, collection and processing decisions.
The most valuable research question to carry into 2027 is therefore specific: For this package, in this market, with this product and recovery system, what evidence shows an improvement—and what would change the conclusion? That question is demanding enough to guide the next generation of packaging innovation without promising that one material can solve every problem.
Sources and Evidence Notes
Sources are linked to public primary records or clearly labeled company disclosures. Dates and units in the text determine how each figure should be interpreted.
- S01 — Eurostat — Plastic packaging waste in the EU: 35.9 kg per person (Oct. 22, 2026)
- S02 — Regulation (EU) 2025/40 — Packaging and Packaging Waste Regulation
- S03 — PackUK — RAM 2027 overview
- S04 — CalRecycle — SB 54 packaging producer responsibility
- S04a — CalRecycle permanent regulations and effective date
- S05 — Oregon DEQ — Plastic Pollution and Recycling Modernization Act
- S06 — Directive (EU) 2024/825 — Empowering Consumers for Green Transition
- S07 — National Bureau of Statistics of China — 2025 Statistical Communiqué
- S08 — State Post Bureau — 2025 Postal Industry Statistical Communiqué
- S09 — State Council — 2025 Interim Regulations on Express Delivery amendments
- S10 — Kingfa Science & Technology — 2025 Annual Report
- S11 — Zhejiang Hisun Biomaterials — 2025 Annual Report
- S12 — Shenzhen YUTO Packaging Technology — 2025 Annual Report
- S13 — Zhejiang Zhongxin — 2025 Annual Report
- S14 — Xianhe Corporation — 2025 Annual Report
- S15 — National Standard GB/T 41010-2021 — Official Metadata
- S16 — Bioleader manufacturing profile (related-party company disclosure)
- S17 — Commission for Environmental Cooperation — Pilot-scale Composting of Certified Compostable Poly-coated Fiber
- S18 — OECD — Global Plastics Outlook
- S19 — UNEP — Turning off the Tap
- S20 — Ellen MacArthur Foundation — Global Commitment 2025 Progress Report
- S21 — Council of the EU — Deforestation-free Products Regulation
- S21a — EUDR amending Regulation (EU) 2025/2650, Article 1(25)
- S21b — Commission EUDR guidance on packing and packaging materials
- S21c — Commission Delegated Regulation (EU) 2026/2102 amending EUDR Annex I
- S22 — State Post Bureau — Green Development Progress 2025
- S23 — European Commission — Guidance Notice on PPWR including PFAS
- S24 — UNEP — Intergovernmental Negotiating Committee on Plastic Pollution
- S25 — Bioleader PLA/PET cup manufacturing capacity announcement (related-party company disclosure)
Found an error? Read our corrections policy and contact the editors.