UFP Packaging’s third-quarter 2026 results show why industrial packaging buyers need a narrower demand signal than supplier revenue growth. In its 28 October release, UFP Industries reported Packaging segment sales of USD 465.845 million, up from USD 394.949 million a year earlier. The segment’s reported sales growth was 18.0%, but its organic-unit growth was 9%.
The issuer’s rounded sales bridge attributes 9% to organic units, 6% to acquisitions and 3% to selling prices. Organic units exclude growth from acquisitions within the previous 12 months. These categories help explain the sales change; they do not turn the revenue total into a measure of industry packaging consumption.
Pallet growth has two different explanations
The three business units offer different like-for-like signals. All figures below are company-reported changes against the prior-year quarter, rather than a survey of the wider market.
| Business unit | Reported organic-unit growth |
|---|---|
| Structural Packaging | 14% |
| PalletOne | 1% |
| Protective Packaging | 5% |
Source: UFP Industries, 28 October 2026 release, UFP Packaging section. Organic-unit measures exclude recent acquisition growth; these are separate business-unit indicators and should not be added together.
PalletOne also reported an additional 18% increase in unit sales from acquisitions. That is a different denominator from the Packaging segment’s 6% acquisition contribution to sales. A buyer using PalletOne’s expansion to forecast pallet demand should preserve the 1% organic figure separately: bringing existing operations into a supplier group can expand its reported units without establishing equivalent growth in the number of pallets its customers consume. The release does not provide a market-wide pallet balance or enough detail to calculate one.
More units did not remove cost pressure
Packaging segment adjusted EBITDA fell to USD 27.250 million from USD 34.284 million, while the reported adjusted EBITDA margin declined to 5.8% from 8.7%. Adjusted EBITDA is a non-GAAP measure. UFP attributed the segment decline primarily to higher transportation costs across its business units and higher material costs. Neither the margin nor the sales bridge is a published price list for a particular crate, pallet or protective pack.
The scope of the freight commentary also matters. UFP reported a USD 19 million year-on-year increase in transportation costs, net of fuel surcharges and price adjustments, in its consolidated discussion. That amount must not be assigned entirely to Packaging. The segment narrative supports a cost-pressure signal, but does not quantify a buyer’s delivery lane, carrier availability or next quoted increase.
Keep the demand forecast separate from the delivered quote
For structural packaging, the 14% organic-unit figure is a reason to check whether an existing programme’s repeat orders and factory loading tell the same story; it is not proof that every plant is short of capacity. For pallet sourcing, acquisition growth belongs in the supplier-footprint record, while the buyer’s replenishment forecast should follow its own pallet issues, returns and replacement orders. Protective Packaging’s 5% signal likewise needs the actual application mix before it can describe a customer’s demand.
The second record is commercial: the specified pack, the route and delivery frequency, the freight allowance or surcharge, and the conditions for revising each price. A supplier can face rising costs while a customer’s own volumes are flat. Conversely, a growing packaging programme need not face the same transport constraint as another lane. Comparing those records prevents a category-growth headline from becoming an unsupported concession in a delivered-price negotiation. Our returnable transit packaging guide explains why pallet issues, returns and cycle time answer different inventory questions.
These are procurement interpretations of one issuer’s unaudited quarterly disclosure. No supplier audit, independent shipment census or customer quote was obtained. The next useful checks are comparable organic-unit reporting and the actual terms and delivery commitments for the buyer’s specification; neither is established by group sales growth alone.
Sources / References
UFP Industries: third-quarter 2026 results, 28 October 2026, issued by UFP Industries through PRNewswire. Relevant original text read: opening, consolidated freight commentary, UFP Packaging table and business-unit commentary. Figures are issuer-reported, with quarter and non-GAAP boundaries retained. Sources checked 29 October 2026.
Photograph credit
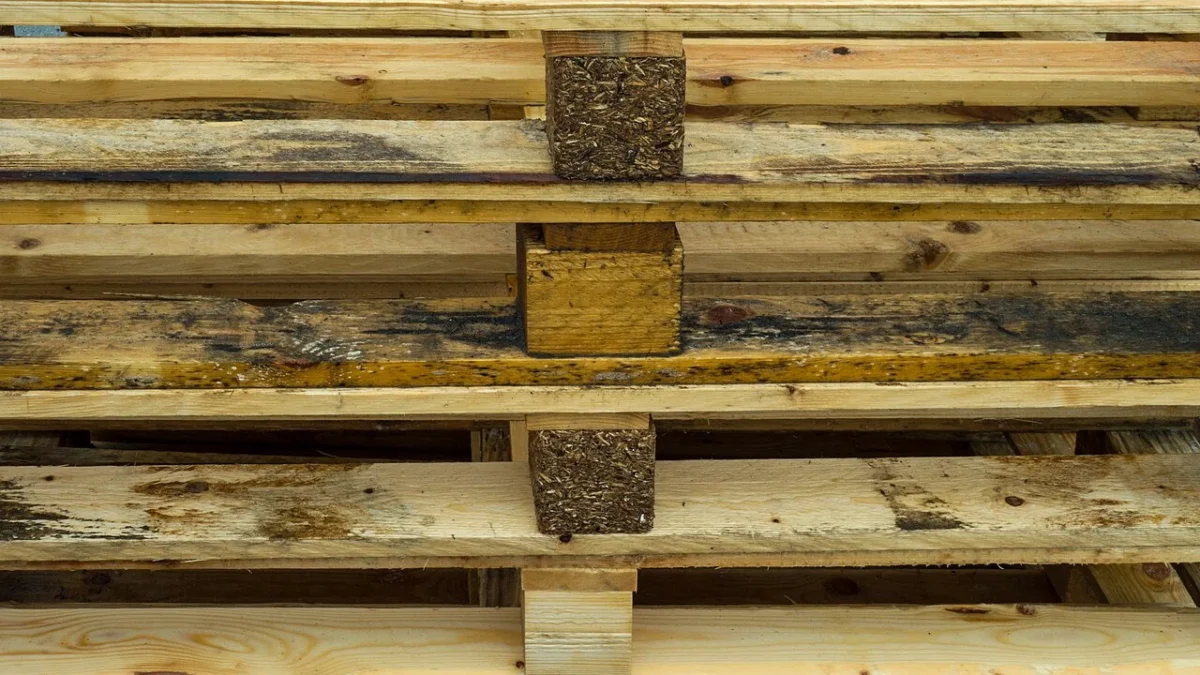
Stacked EUR pallets in Grötö industrial area, Lysekil, Sweden, photographed 31 March 2017 by W.carter. Original photograph and provenance; CC0 public-domain dedication. Full composition retained; resized and converted to WebP. Archival material context, not a UFP facility, shipment or evidence of current inventories.
Found an error? Read our corrections policy and contact the editors.