
China’s polypropylene (PP) index rose from September to early November 2026. The increase gives food packaging buyers a reason to test alternative compounds. The decision depends on what the compound costs per 1,000 accepted containers. This report models how calcium carbonate changes that calculation and identifies the additional evidence needed for a starch blend.
Executive Summary
JLC’s China PP index on November 4 was 16.5% above its September monthly average. The change makes it worth comparing conventional PP with compounds that replace part of the polymer with starch or calcium carbonate. The index measures market movement. The cost model below uses separate, hypothetical prices. [1]
Opaque rigid trays and plates are a practical starting point for trials. The sources reviewed here establish market conditions and experimental material behavior. A shift in purchasing would require representative shipment or order data, which this report does not have.
Main finding. At a fixed material volume, adding calcium carbonate increases container weight. Whether the heavier container saves money depends on the finished weight, the compound quote and the cost of producing an accepted unit.
1. What the November 2026 PP Price Data Actually Show
JLC reports separate daily and monthly PP index series for China. The latest daily reading in this review was 11,563 on November 4, down 44 points from November 2. [1]
| Period / date | JLC PP index value | Reading |
|---|---|---|
| September 2026 average | 9,923.55 | Baseline monthly average |
| October 2026 average | 10,806.33 | About 8.9% above September |
| November 2, 2026 | 11,607 | Highest of the three November readings shown |
| November 3, 2026 | 11,576 | Down 31 index points |
| November 4, 2026 | 11,563 | Down another 13 index points |
JLC lists these figures as index values. The daily and monthly series use different reporting periods. Obtain a dated, grade-specific supplier quote for a purchasing decision. [1]
The October monthly average was about 8.9% above September. The November 4 daily reading was about 16.5% above the September average. The latter compares one day with a full-month average, so it does not measure November’s monthly change.
Interpretation: A volatile feedstock market can make alternative compounds worth testing without demonstrating a lasting structural change in consumption. The price signal is real; the scale of substitution remains unmeasured.
2. Three Different Materials Buyers Should Not Confuse
| Material route | What it replaces | Commercial attraction | Main limitation |
|---|---|---|---|
| Conventional PP | None | Well-established processing, low density and known performance | Direct exposure to PP resin prices |
| Starch–PP / TPS–PP | Some PP is replaced by a starch-derived fraction | Potentially less fossil-polymer content; product differentiation | Moisture sensitivity, compatibility, processing and formulation costs |
| Calcium carbonate–PP | Some PP is replaced by mineral filler | Potentially lower compound cost and altered rigidity | Higher density, altered toughness and possible heavier finished items |
These materials belong to different commercial and technical categories. A starch-containing compound is not automatically PP-based; a mineral-filled PP compound is still a plastic composite. Neither its appearance nor its advertised percentage proves biodegradability, compostability or suitability for food contact.
Starch–PP is a formulation, not a single material specification
A 2022 study tested extruded sheets at a 70:30 PP-to-thermoplastic-babassu-starch mass ratio. It reported changes in water affinity and in the tensile response with different compatibilizers. Results apply to the studied blends and process. [3]
For sourcing, ask how much of the compound is starch and which polymers, fillers and additives make up the balance. Bioleader’s guide to corn starch tableware composition and sourcing considerations explains which formulation and food-contact records buyers can request from suppliers.
Filler chemistry and surface treatment affect the result
Ren and colleagues tested talc, calcium carbonate and barium sulfate in PP and PP copolymer. The study’s thermogravimetric measurement of 70 wt.% filler applies to its talc composite (p. 174). The calcium carbonate experiments are reported separately in Figure 3 and Table 3. The 50–70% calcium carbonate cases below are modeled inputs. Drop, hinge, seal and thin-wall performance would require trials for the specific package. [2]
Do not confuse masterbatch content with finished-article content
A masterbatch described as 70% calcium carbonate is not the same as a finished container containing 70% calcium carbonate. For example, if a converter uses 30% of a masterbatch that itself contains 70% calcium carbonate, the finished blend gets approximately 21% calcium carbonate by mass from that masterbatch, before considering other ingredients. Every supplier comparison should request the composition of the final article, not merely the concentrate.
3. Original Density Model: The 20-Gram PP Container Problem
The model uses 0.90 g/cm³ for PP and 2.70 g/cm³ for a calcite-like filler. These rounded inputs approximate the study’s PP density and the density of calcite. A buyer should use the supplier’s grade-specific values in a quotation model. [2] [6] On a simplified equal-volume basis, adding mineral filler increases the density and the finished weight.
For this calculation, we treat a conventional 20-gram PP container as the baseline, hold its geometrical material volume constant and assume ideal additive volumes. We do not assert that a thicker or thinner wall would be unnecessary in practice.
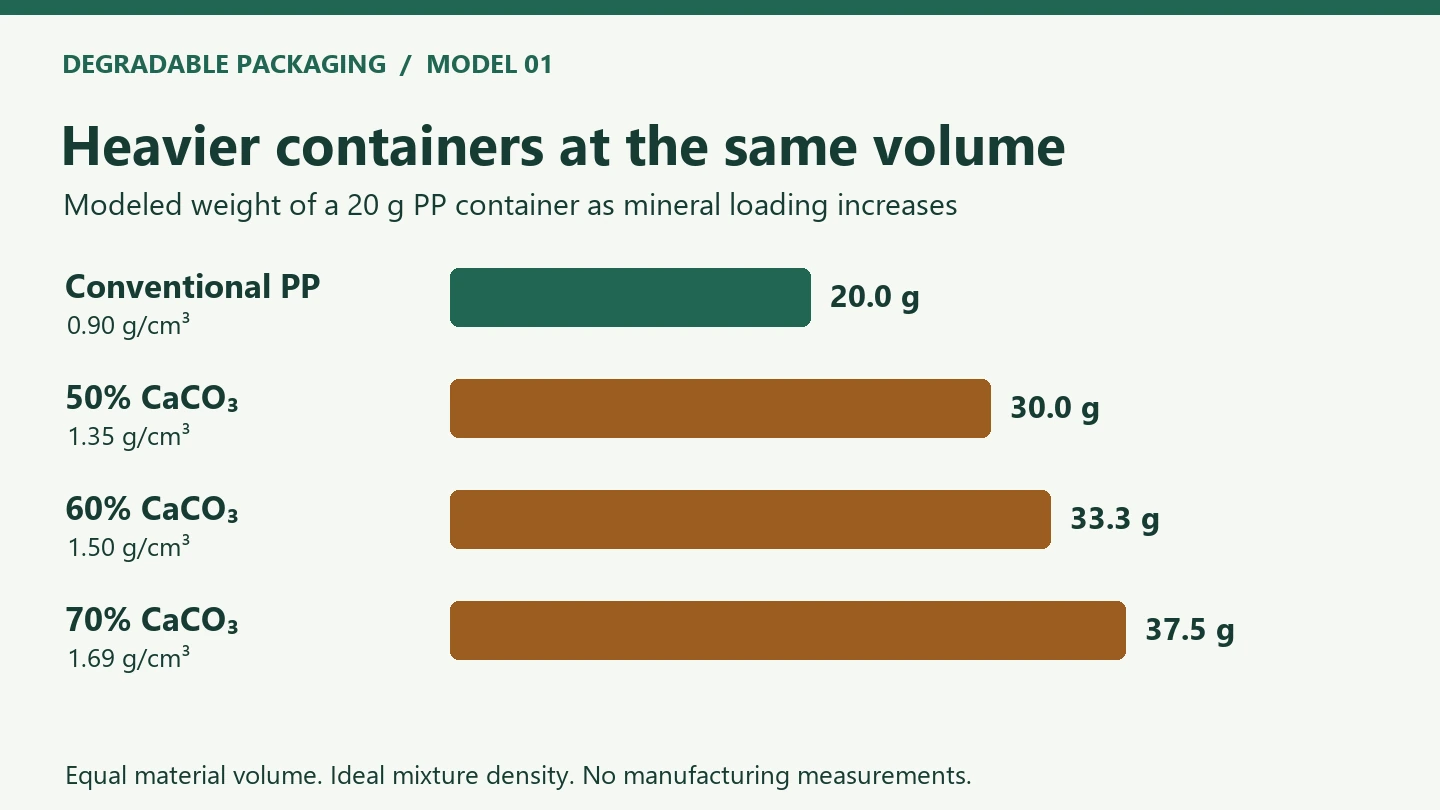
| CaCO₃ by mass | Estimated composite density | Same-volume container weight |
|---|---|---|
| 0% | 0.90 g/cm³ | 20.0 g |
| 50% | 1.35 g/cm³ | 30.0 g |
| 60% | 1.50 g/cm³ | 33.3 g |
| 70% | 1.69 g/cm³ | 37.5 g |
Density estimate: ρblend = 1 / (wPP/0.90 + wCaCO3/2.70), where each w is a mass fraction. Idealized, with no porosity, other additives or processing effects.
A 70%-filled composite can therefore require approximately 37.5 grams to occupy the same volume as a 20-gram PP item in this simplified model. That is 87.5% more mass, even though the formulation uses considerably less PP per kilogram of material.
Purchasing implication: tonnes of compound purchased and number of acceptable containers shipped are not interchangeable economic units.
4. Original Break-Even Model: The Right Comparison Is Per 1,000 Containers
Assume a PP quote of CNY 11,563 per tonne. At 20 g each, 1,000 containers use 20 kg of material, giving a resin-only cost of CNY 231.26. The scenario borrows the numerical level from the JLC index to illustrate the arithmetic. The CNY/t unit is an assumption for the model.
The following table answers a more useful question: How low would the compound price need to be merely to match the PP material cost per finished item?
| Final CaCO₃ content | Estimated weight | Maximum compound price to break even |
|---|---|---|
| 50% | 30.0 g | CNY 7,709/t |
| 60% | 33.3 g | CNY 6,938/t |
| 70% | 37.5 g | CNY 6,167/t |
All three values are derived thresholds, not current supplier quotes. Break-even compound price = PP reference price × (20 g ÷ alternative item weight). The model assumes equal material volume and excludes conversion costs. Calculations use unrounded weights and round the displayed results.
The surprising result is that the maximum affordable price per tonne falls as the mineral loading and item weight increase. Higher mineral content does not mechanically guarantee larger per-unit savings. Whether the actual compound becomes inexpensive enough is a separate sourcing question.
Price reversal scenario: a hypothetical 60% mineral compound
Assume a fully compounded mineral-filled PP material costs CNY 6,500/t and the equal-volume finished item weighs about 33.3 g. The table holds the compound price fixed while comparing assumed PP quotes of CNY 11,563/t and CNY 9,923.55/t. Both are scenario inputs, inspired by the numerical index levels.
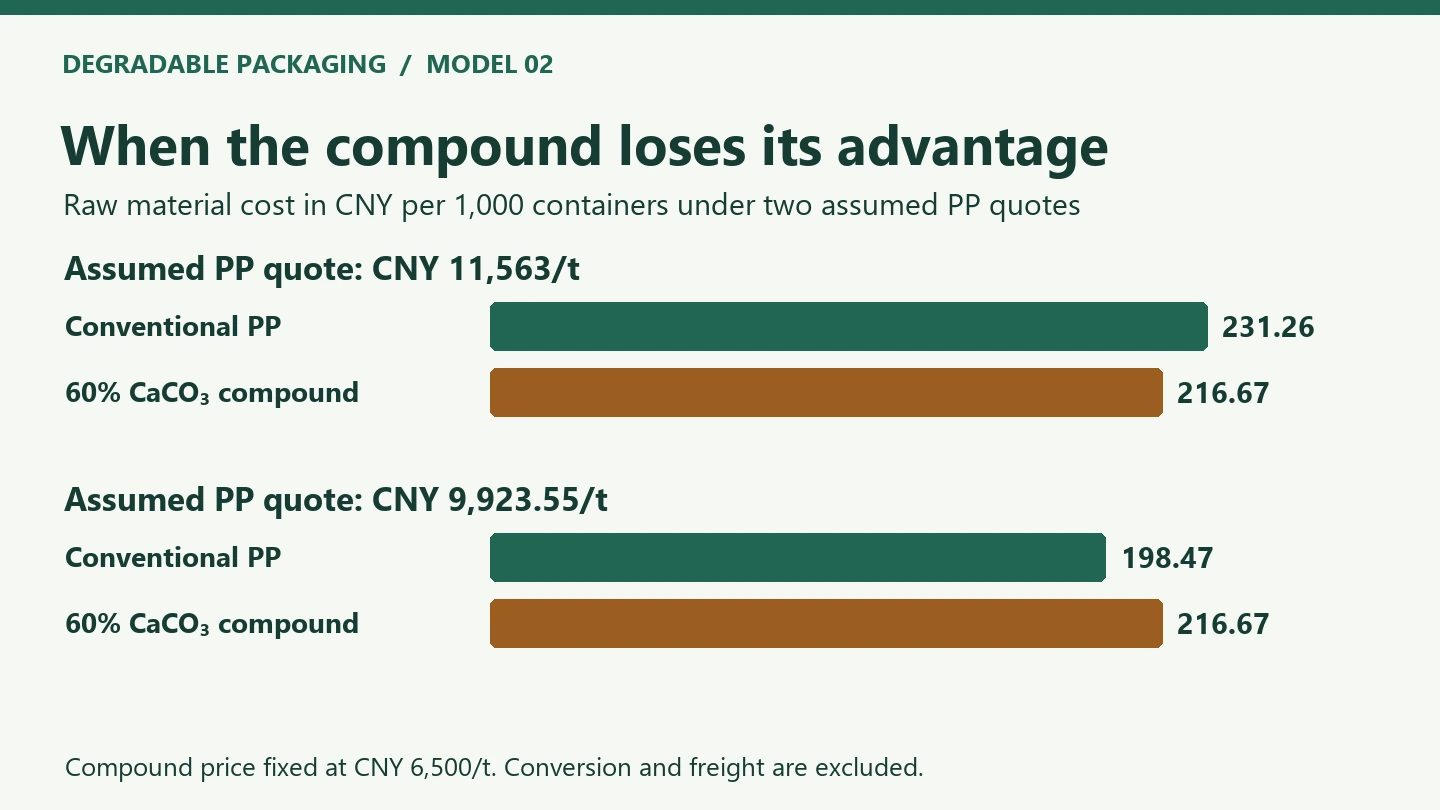
| Assumed PP price (CNY/t) | 20 g PP item: material cost per 1,000 (CNY) | 33.3 g composite item: material cost per 1,000 (CNY) | Relative outcome |
|---|---|---|---|
| CNY 11,563/t | CNY 231.26 | CNY 216.67 | Composite ~6.3% lower |
| CNY 9,923.55/t | CNY 198.47 | CNY 216.67 | Composite ~9.2% higher |
In this scenario, the crossover point is a PP price of approximately CNY 10,833/t. Below that, the hypothetical composite loses its raw-material-per-item advantage unless its own price also changes. Real-world composite prices would typically be exposed to PP costs too; the constant-price assumption is deliberately simplified for sensitivity analysis.
At the higher assumed PP price, the composite saves CNY 14.59 in materials per 1,000 containers. That is the most it can absorb in additional conversion, reject or freight costs before the modeled saving disappears. At the lower assumed PP price, the composite starts with a material cost penalty of CNY 18.20 per 1,000.
5. What a Real Buyer Should Test Before Switching
The model is a screening tool, not a product-qualification result. A low-priced compound is commercially useful only if it produces acceptable products at the required output rate.
| Application | Initial suitability to investigate | Non-negotiable validation |
|---|---|---|
| Opaque rigid plates and trays | Relatively promising for mineral-filled trials | Drop resistance, warpage, nesting, unit weight |
| Food boxes and compartment containers | Possible, but formulation-dependent | Hinge or corner integrity, oil/heat exposure, stacking |
| Snap-fit lids, very thin walls, flexible hinges | Greater technical risk | Impact toughness, fatigue, fit, leak performance |
| Starch-based bowls and food containers | Application and polymer-system dependent | Exact composition, moisture resistance, hot-food tests, food-contact declaration |
The Bioleader® cornstarch tableware range lists food containers, compartmented boxes, plates and bowls. These formats illustrate the products offered in this category. Before comparing an individual product with the starch–PP study, ask for the exact polymer system and a current grade or formulation declaration. Catalogue listings establish neither a uniform PP content nor compostability. The cost tables quantify the calcium-carbonate scenario only. A starch-blend cost comparison needs its own quote, measured part weight and conversion yield.
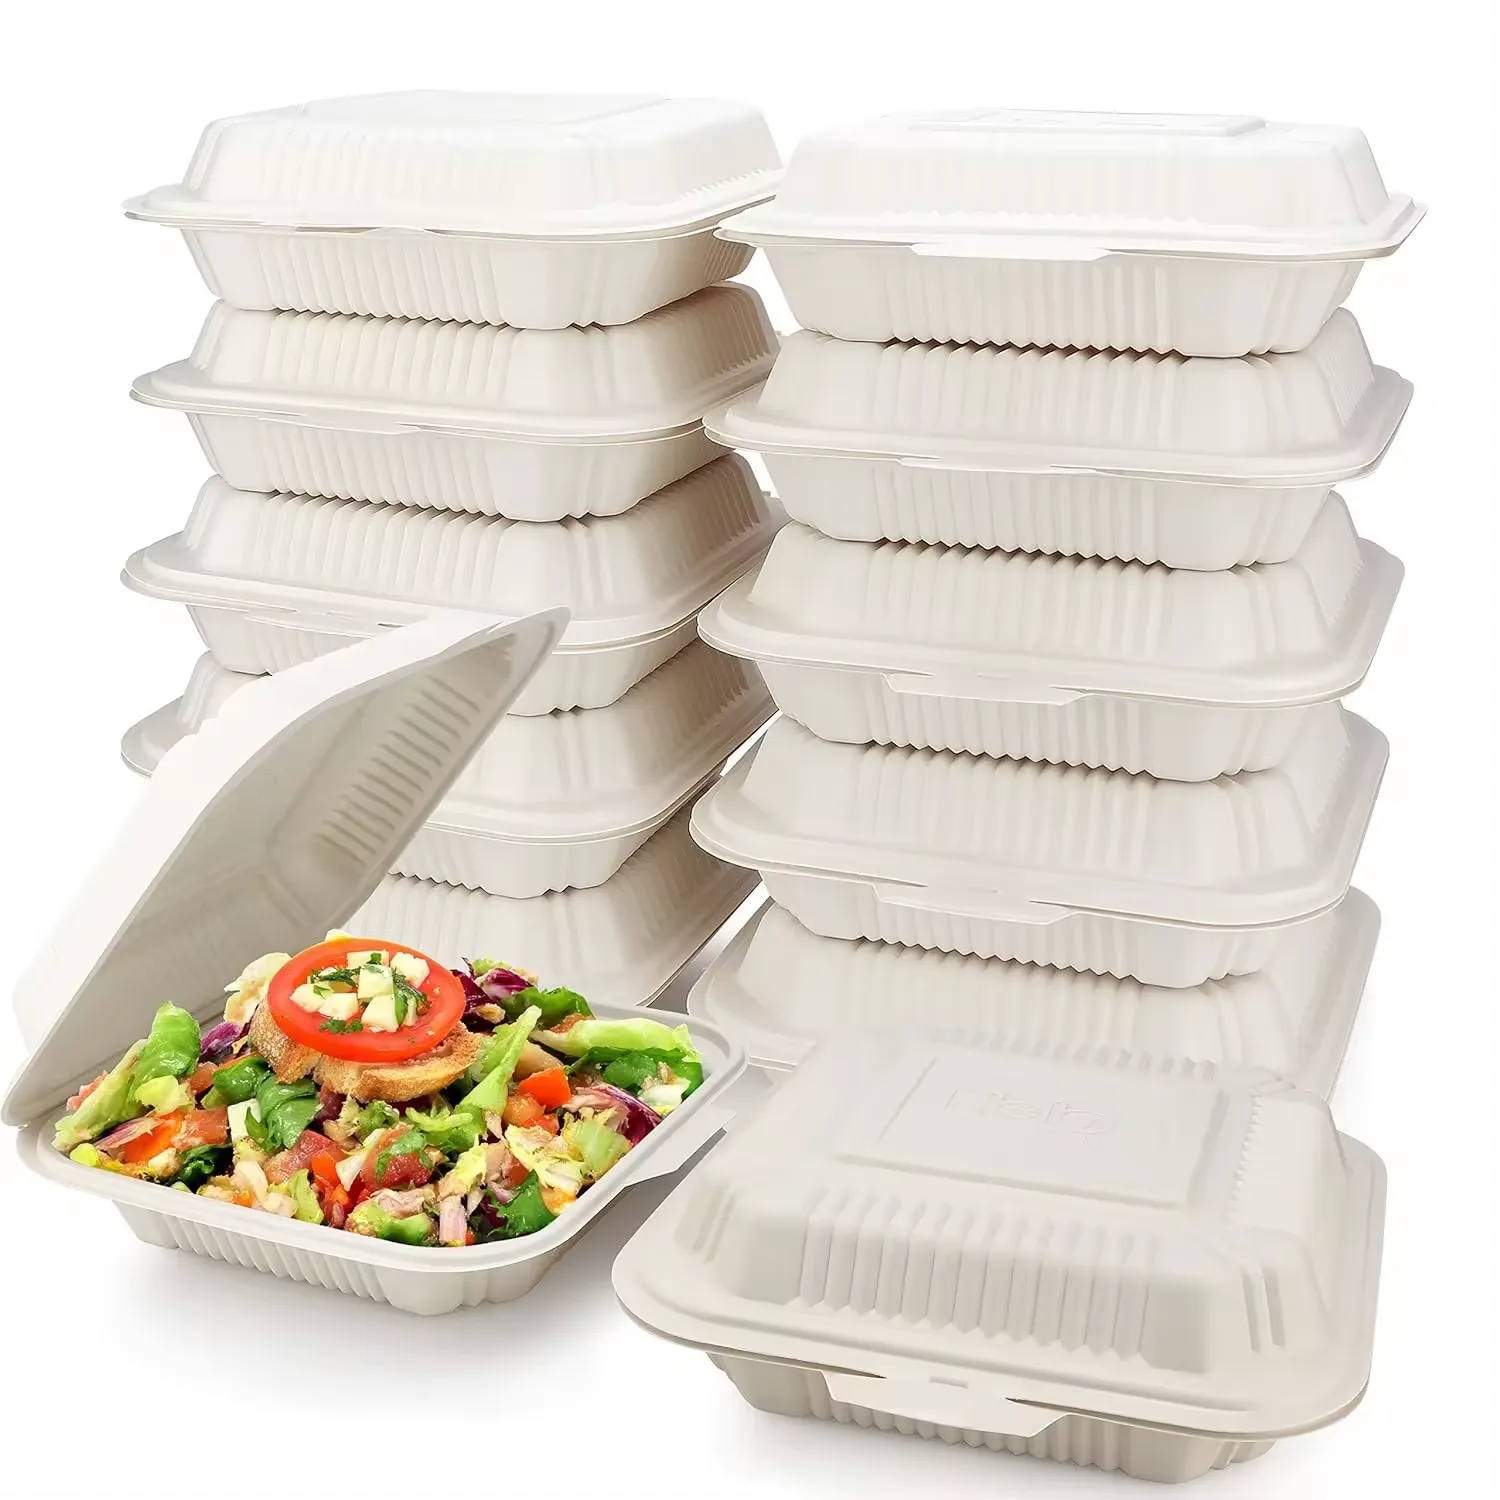
For each alternative formulation, obtain the actual quote on a consistent incoterm and compare cost per 1,000 accepted finished units: compound price × article weight, plus machine time, rejects, secondary packing, freight, quality-control tests and any tooling or compliance costs. A well-designed trial should record the baseline PP grade and the replacement grade side by side.
This aligns with Degradable Packaging’s earlier discussion of buyer requirements, certification scope and total cost in 2026: supplier claims become commercially useful when tied to the actual SKU and conditions of purchase.
6. Can Starch or Calcium Carbonate Make a PP Container Biodegradable?
No such conclusion follows from filler content alone. A PP composite does not become demonstrably biodegradable or compostable merely because it includes starch or a high percentage of mineral filler. The polymer matrix, full formulation, degradation pathway, test conditions and applicable standards all matter.
Starch-based packaging also covers materially different systems. Some products may be based on starch combined with polymers other than conventional PP. Others may include PP. It is unsafe to apply the performance, compostability or labeling claims of one system to another without composition-specific and finished-article evidence.
For plastic food-contact materials within the scope of Commission Regulation (EU) No 10/2011, check the applicable composition and migration rules for the finished construction and intended conditions of use. Separately, the Commission’s September 2026 single-use plastics guidance explains the polymer and product scope under Directive (EU) 2019/904. The presence of starch or a mineral filler alone does not determine whether a product falls within that scope. [4] [5]
For an environmental comparison, an increase in product mass and potential changes in recyclability or local collection should be included alongside any reduction in virgin PP input. A lower petrochemical fraction per kilogram is not the same as a verified lower environmental burden per container.
7. Our Outlook: Three Conditions for a Durable Substitution Trend
Near term — enquiries and price comparison: If PP remains expensive, more buyers may seek alternatives, especially where existing tooling can process approved compounds. This is a scenario, not a claim that enquiries have already increased by any measured amount.
Following months — selective production trials: We would expect the strongest initial opportunities in comparatively rigid, opaque formats with manageable performance requirements. Thin-wall and closure-intensive products warrant more caution.
If PP prices fall — repeat-order test: Sustained adoption depends on whether the alternative remains cheaper at equivalent finished-product performance. If the cost advantage disappears, some converters may return to standard PP.
For that reason, we would monitor five indicators before calling this a structural material transition:
- Grade-matched price spreads: real quotations for the applicable PP and fully compounded alternatives, not unmatched resin indexes.
- Finished weight and conversion yield: grams per accepted unit, cycle time and rejection rate.
- Qualification evidence: application-specific strength, heat, sealing and food-contact documentation.
- Repeat orders: orders placed after successful trials rather than sample requests alone.
- Performance after PP falls: whether a competitive cost advantage survives a lower resin market.
These indicators can establish whether a market shift is occurring; without them, a claim that buyers are widely abandoning PP would be premature.
8. Frequently Asked Questions
Does a PP price surge automatically make starch-based food containers cheaper?
No. A starch-containing formulation may use less PP, but compound price, processing performance, moisture behavior, container weight and production losses determine the finished cost. The exact polymer system must also be identified.
Can a food container contain 60% or 70% calcium carbonate?
Published experiments show that high filler loading depends on the material and treatment. The calcium carbonate percentages in this report are model assumptions. Suitability for a particular container requires finished-article evidence. It must be demonstrated through processing trials, mechanical tests and food-contact compliance for the final article.
Is 70% calcium carbonate masterbatch the same as 70% in the finished container?
No. If a formulation uses 30% of a masterbatch containing 70% calcium carbonate, the added mineral contributes approximately 21% of the final mass, assuming the rest of the formulation contains no additional calcium carbonate.
Why might mineral-filled PP cost more per container despite cheaper resin?
Calcium carbonate is denser than PP. At similar geometry, the item may weigh considerably more. Additional wall thickness, conversion losses or freight costs can further offset lower compound pricing.
Are starch–PP or calcium carbonate–PP products compostable?
Neither material should be described as compostable simply because it contains starch or mineral filler. Claim suitability depends on the full formulation, finished-article test results, applicable standard and the relevant waste-management system.
Editorial Verdict
The early-November index readings support testing alternative compounds. Evidence of a wider switch would come from repeat orders at equivalent performance and sustained savings per accepted container.
The likely beneficiaries are converters with qualified formulations, matched equipment and transparent finished-product economics. A 70%-mineral-filled compound may be cheaper per tonne but heavier per item; a starch-based product may have attractive feedstock characteristics but still need formulation-specific performance and regulatory validation.
Our final judgment: PP volatility can accelerate the search for alternatives, but the winners will be determined by cost per usable container, not filler percentage or raw-material marketing claims. A lasting switch must remain attractive after the PP market stops rising.
Methods
This is an original editorial cost analysis based on publicly available market data, technical research and regulatory documents. It is not a factory audit, a representative order survey, proprietary pricing intelligence or an independent performance test. The figures are labeled models with explicit assumptions; they should not be read as evidence of a measured commercial price or production result.
Disclosure. Bioleader® is an industry and commercial related party of Degradable Packaging. Its sourcing guide and product catalogue are manufacturer examples. Degradable Packaging’s cost model and market analysis do not independently verify Bioleader’s product claims.
Sources
- JLC / Jinlianchuang. China PP price index. September and October monthly averages and November 2–4 daily readings, checked November 4, 2026.
- Ren, Z., Shanks, R. A. and Rook, T. J. (2002). Processing and Properties of Polypropylene Composites with High Filler Content. Polymers and Polymer Composites, 10(2), pp. 173–182. See Materials, Filler Content, Figure 3 and Table 3.
- Maniglia, B. C., Vedove, T. M. A. R. D. and Tadini, C. C. (2022). Evaluation of carboxylic acids as sustainable compatibilizing agents on blend sheets properties based on thermoplastic babassu starch and polypropylene. Frontiers in Food Science and Technology.
- European Union. Commission Regulation (EU) No 10/2011, consolidated July 14, 2026. See Articles 2, 5–6 and 11–12.
- European Commission. Updated guidance on single-use plastic products, C/2026/4813, September 8, 2026. See Sections 2.1 and 2.2.
- NIST. Certification of Standard Reference Material 915c Calcium Carbonate. Section 5.1.4.1 for calcite density.
Found an error? Read our corrections policy and contact the editors.