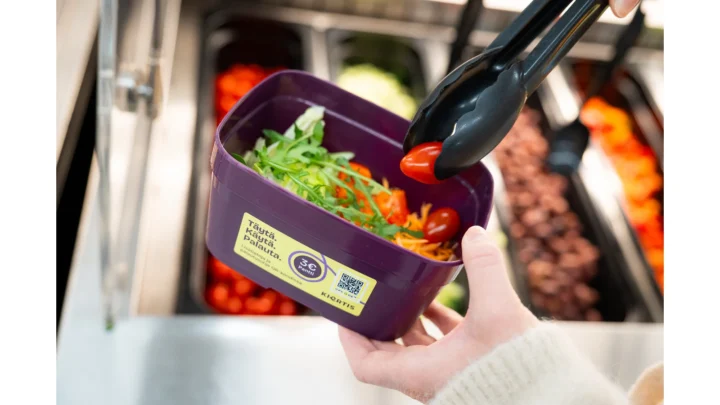
A reusable food container does not become economical because it is durable.
It becomes economical only if it comes back.
That sounds obvious, but it changes the entire comparison with single-use packaging. A single-use container is bought once and used once. A reusable container carries a larger upfront cost, then asks the system to recover that investment over repeated cycles of return, collection, washing, inspection and redistribution.
Every lost container cuts that recovery short.
This is why the most important number in a reuse system is often not the advertised design life of the container. It is the number of successful uses actually achieved before the container disappears, breaks, becomes unacceptable or is retired.
The missing-container problem
Suppose a reusable container costs five times as much as a comparable single-use container.
If it is used twenty times, the purchase cost per use becomes one-quarter of the single-use purchase cost before washing and logistics are added.
If it disappears after the second use, the economics reverse.
The basic system equation is:
Cost per successful service = (initial pool purchase + actual replacement purchases + collection, washing, redistribution and administration over a defined period − any residual asset value) ÷ successful services delivered in that period. Do not count a lost container again as both its full original capital cost and a duplicate “loss charge.”
That is not an accounting standard. It is a way to force the right variables into the same boundary.
The key word is achieved.
A 95% return rate does not mean 95 uses
Return-rate percentages are easy to misread.
In a simplified system where each use has the same independent probability of the container being returned, expected lifetime rises sharply as the return rate approaches 100%.
| Return probability after each use | Simplified expected uses before loss | Interpretation |
|---|---|---|
| 80% | 5 | One loss for roughly every five use cycles |
| 90% | 10 | Enough for some systems, too low for others |
| 95% | 20 | Substantially better asset recovery |
| 98% | 50 | Longer life becomes plausible |
| 99% | 100 | Small further return-rate gain has a large lifetime effect |
Original explanatory model / editorial matrix. The geometric calculation is not observed field performance, and environmental break-even is separate from financial break-even. [S1] [S2] [S3] [S4]
The calculation is simply:
expected uses ≈ 1 ÷ (1 − return rate).
This geometric model counts the first use and assumes immediate redeployment after each independent successful return, with a constant return probability and no durability cap. With a maximum of N uses, expected uses are (1 − rN) ÷ (1 − r). Breakage, rejection, time limits and changing cohorts can reduce achieved service further.
But it demonstrates the nonlinear economics.
Improving return from 90% to 95% does not merely add five percentage points. Under the simplified attrition model, it doubles the expected number of uses from about ten to twenty.
For example, at r = 0.95 and a 20-use durability cap, expected uses are about 12.83, not 20. In the unbounded model, only 0.9523 ≈ 30.7% of items reach a 24th use. An expected lifetime is not a promise that every item reaches a study’s break-even count.

Real reuse studies show why return rate belongs in the financial model
A 2024 study of a reusable takeaway system at the University of Sheffield reported a customer return rate above 98.5% over a year. [S1]
The system allowed customers to borrow a container without charge as long as it was returned within two weeks; payment details were held in an app and a charge applied if the container was not returned. [S1]
The researchers used a 98.6% return rate to derive a theoretical lifetime of about 70 uses for their life-cycle analysis. [S1]
That figure was not the manufacturer’s durability claim.
It was the consequence of system return behavior.
The same study found that, excluding the standing monthly service charge, the reusable container cost the café about £0.06 more per use than the single-use container under the studied system. A £0.30 surcharge on single-use containers covered the difference while both formats remained in use. [S1]
Once standing charges were included, viability depended on total takeaway volume and the share of customers using the reuse scheme.
That is a useful warning: even a very high return rate does not automatically make every reuse business model cheaper.
Washing is not a side cost
In the Sheffield study, washing accounted for 39% of the reusable container’s global-warming impact under the modeled conditions. [S1]
For the economics, washing also creates recurring costs:
- labor;
- water;
- energy;
- detergent and sanitizer;
- equipment depreciation;
- facility rent;
- quality control;
- drying and storage.
A reuse system with a cheap container can still be expensive if washing is inefficient.
Conversely, centralized washing can gain scale—but centralization adds collection distance and handling.
The public author-institution abstract of a 2025 study models a proposed Galveston, Texas system, comparing centralized and decentralized washing for cups. It reports lower greenhouse-gas impacts but roughly two to two-and-a-half times the single-use cost in its large-scale scenarios. The full model was not accessible in this review; this is an attributed case, not a tested food-container cost benchmark. [S3]
Scale can improve utilization of washing equipment. It can also create another logistics network that has to be paid for.
The economics improve when one truck collects many returns, not one return
Return logistics are rarely about distance alone.
They are about collection density.
A truck traveling ten kilometers to collect 500 containers is not economically equivalent to a vehicle traveling the same distance to recover 20.
This is why closed environments often look attractive for reuse:
- campuses;
- corporate cafeterias;
- stadiums;
- airports;
- festivals;
- dense urban delivery zones.
They can concentrate consumption and return points.
The system does not need every customer to make a special trip back to the original restaurant.
A 2024 Finland-use LCA compared polypropylene takeaway containers using a common one-container-use functional unit and modeled recycling or incineration. The authors report an approximately six-use climate break-even in the recycling scenario; washing efficiency and return transport affect the result. This is an environmental model, not a six-use financial break-even. [S2]
A Seoul pilot put an economic break-even number on the system
A paper in the March 2026 issue of Cleaner Environmental Systems, with a 2025 DOI identifier, analyzes a 127-day Seoul food-delivery pilot and modeled life-cycle costs. It compares stainless-steel reusable containers with single-use plastic and examines drop-off versus doorstep collection. [S4]
The system included reusable containers, return stations, collection logistics and a dedicated washing facility.
For drop-off collection, the paper reports an average greenhouse-gas break-even of about 4.6 uses across the modeled container formats; individual values range from 3.2 to 7.9. [S4]
Its average economic break-even is about 24 uses for drop-off collection, with modeled values of 17–37 among formats that reach break-even. The table excludes formats with no economic break-even from the average. Doorstep collection has a different average of 48 uses, not 24. [S4]
That gap is important.
A reuse system can become environmentally preferable before it becomes cheaper.
The authors’ sensitivity analysis identifies return rate and collection efficiency as important cost and greenhouse-gas variables. We do not turn those case-specific sensitivity percentages into a general return-rate correction factor. [S4]
The study found economic performance more sensitive to return rate, while environmental performance was especially sensitive to collection efficiency.
There is no universal “reuse wins after 24 uses” rule.
The number belongs to that Seoul system, those containers and those cost assumptions.
Design life and achieved life are different assets
A supplier may say a reusable bowl is designed for 100 washing cycles.
That tells the buyer something about physical durability.
It does not tell the buyer whether the bowl will actually be used 100 times.
The achieved life is limited by the earliest of several events:
- customer does not return it;
- container breaks;
- lid is lost;
- surface becomes unacceptable;
- staining or odor causes retirement;
- barcode/RFID identity fails;
- container is discarded by mistake;
- format is removed from the operating system.
A business case based on “100-cycle durability” but achieving only 12 uses is not a 100-use system.
Loss rate behaves like a hidden packaging purchase
Every lost reusable container has to be replaced if the pool size is to stay constant.
That makes loss a recurring purchasing cost.
If 1,000 container-use cycles are completed and the eventual non-return rate is known and 5% do not return, the steady-state replacement requirement is roughly 50 containers just to maintain the pool, before accounting for breakage or quality retirement.
At 1% loss, replacement falls to roughly 10.
The difference is forty replacement containers per 1,000 uses. This assumes completed return windows and steady flow; an item not yet due back is not a loss.
This is why deposits, account-based borrowing, app reminders, convenient return points and interoperable return networks can have a direct economic value even when they add administrative cost.
Deposits change return incentives and cash flow
A deposit can improve return behavior because the user has money at risk.
But deposits create their own operating requirements:
- payment processing;
- refund handling;
- customer service;
- unclaimed balances;
- fraud controls;
- accounting;
- consumer acceptance.
Deposit size also changes customer experience.
Too small, and it may not change behavior. Too large, and it can reduce adoption.
The correct question is not “Does the system use a deposit?”
It is:
Does the return mechanism improve achieved uses enough to pay for the mechanism itself?
Washing capacity has a utilization problem too
A commercial dishwasher or central wash hub has fixed costs whether it runs full or half empty.
Low throughput therefore raises wash cost per container.
High throughput can lower unit cost, but only if the operator avoids bottlenecks in:
- collection;
- sorting;
- inspection;
- washing;
- drying;
- redistribution.
The reuse system has its own version of manufacturing utilization.
A city may have enough containers in circulation but still have poor economics if wash assets, vehicles or return stations are underused.
Standardization can be an economic lever
A closed-loop system with fifteen bowl sizes, six lid families and many proprietary shapes is harder to wash, store and redistribute than a standardized pool.
Standardization can improve:
- stacking;
- wash-rack utilization;
- lid matching;
- inventory pooling;
- cross-merchant returns;
- replacement planning.
But standardization can conflict with branding, portion sizes and food-performance needs.
Again, the system—not the material—determines whether reuse is economically attractive.
PPWR adds an operating context; it does not settle the cost comparison
The EU Packaging and Packaging Waste Regulation gives reuse systems a larger strategic role.
The Commission’s current implementation overview describes PPWR reuse work and a February 2026 delegated exemption for pallet wrappings and straps from the 100% transport-packaging reuse targets. Exact duties depend on format, operator, timing and applicable exemptions; this article does not offer an Article 29 applicability determination. [S8]
Reuse policy does not establish that a given takeaway container is cheaper, environmentally preferable or mandatory. The financial model must still use the actual service and return system.
This does not prove that reuse is cheaper.
It means more companies will have to solve the operational economics rather than treating reuse only as a sustainability pilot.
When does reuse actually beat single use on cost?
There is no universal cycle count.
The economic break-even number changes with:
| Variable | Moves reuse toward break-even when… | Moves reuse away from break-even when… |
|---|---|---|
| Container purchase cost | Durable item is inexpensive for its achieved life | Heavy/high-cost item is lost early |
| Return rate | Most containers come back | Pool leaks containers each cycle |
| Washing | High-throughput, efficient wash process | Small batches / expensive labor-energy-water |
| Return logistics | Dense routes and convenient pooled return points | Dedicated long trips for low volumes |
| Breakage / retirement | Container survives accepted service life | Damage, staining or wear retires it early |
| Administration | Tracking/payment system scales over high volume | High per-transaction overhead |
| Single-use comparator | Single-use is costly, taxed or charged | Single-use is extremely cheap and disposal externalities remain unpriced |
Original explanatory model / editorial matrix. The geometric calculation is not observed field performance, and environmental break-even is separate from financial break-even. [S1] [S2] [S3] [S4]
The decision rule is operational, not ideological
Reuse tends to make economic sense where the package can circulate many times in a dense, controlled system with efficient washing and low losses.
Single use can remain economically stronger where return distances are long, participation is low, volumes are fragmented or the reusable asset disappears before enough cycles are achieved.
That means a closed campus and a dispersed delivery market should not be judged with the same cycle-count slogan.
The correct comparison is:
cost per successful service delivered.
For reusable packaging, that means measuring real achieved cycles—not quoting design life.
The uncomfortable reuse question
The question most reuse proposals ask is:
“How many times can this container be reused?”
The financially useful question is different:
“How many times will we actually get it back, wash it, and put it into service again before we have to buy another one?”
That number determines whether the asset earns back its purchase cost.
Everything else—deposit, app, wash hub, return station, route density, standardization—is ultimately a system for improving that number without spending more than the additional uses are worth.
Methodology and editorial note
Full lawful repository papers were read for Sheffield and the Finland-use LCA. The Galveston result is an attributed author-institution abstract, while the Seoul account uses publisher-indexed relevant methods, results and Tables 3–4; the complete supplementary model was not examined. No new LCA or operator cost audit was performed. The geometric attrition and finite-life examples are original deterministic calculations, not field performance. Current PPWR context is deliberately limited to the Commission implementation overview. Sources checked 19 October 2026. No supplier audit, factory inspection or independent market census was performed for this article.
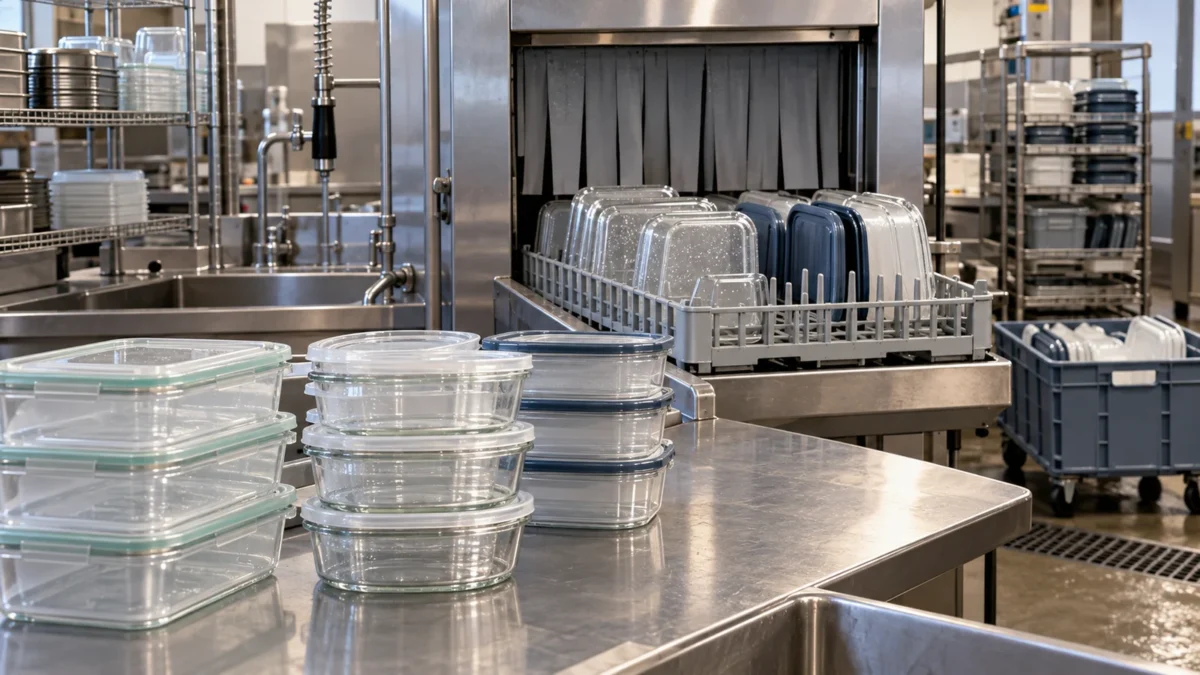
The main image is an AI-generated editorial illustration of a generic scene, not a real named company, product, experiment or facility. The in-body figure is an original source-grounded synthesis or labelled calculation.
Official sources and reference notes
- [S1] Resources, Conservation & Recycling. Integrating behavioural, material and environmental science to inform the design and evaluation of a reuse system for takeaway food. Resources, Conservation & Recycling 209, October 2024,107815; DOI 10.1016/j.resconrec.2024.107815. Methods2.3–2.4; results3.3–3.4; theoretical lifetime, wash allocation and economic charges. Full lawful author-repository paper; relevant methods/results read. Accessed 19 October 2026.
- [S2] Journal of Cleaner Production. Life cycle assessment of reusable plastic food packaging. Journal of Cleaner Production 448,2024,141529; DOI 10.1016/j.jclepro.2024.141529. LCA modeled scenarios; washing, transport and recycling end-of-life sensitivity. Full lawful research-institute repository paper read; PP construction, Finland-use boundary, functional unit, modeled washing/transport and recycling scenario checked. Accessed 19 October 2026.
- [S3] Resources, Conservation & Recycling. Scaling up reusable container systems through city-wide centralized collection and washing. Resources, Conservation & Recycling 215, April 2025,108154; DOI 10.1016/j.resconrec.2025.108154. Author-institution public abstract; Galveston proposed cup system and scale. Author-institution public abstract only; full city model not examined. Accessed 19 October 2026.
- [S4] Cleaner Environmental Systems. Environmental and economic feasibility of reusable container system for food delivery service in Seoul, South Korea. Cleaner Environmental Systems 20, March 2026,100385; DOI 10.1016/j.cesys.2025.100385. Publisher-indexed methods2.1, results3.1–3.2, Tables 3–4 and average exclusions. Publisher-indexed relevant methods, results and Tables 3–4 read; full supplementary model not examined. Accessed 19 October 2026.
- [S8] European Commission. Packaging and Packaging Waste Regulation implementation. Current implementation overview checked 19 October 2026. Latest developments: February 2026 pallet-wrapping and strap exemption; reuse implementing work. Official implementation overview; no product-specific Article 29 determination. Accessed 19 October 2026.
The public corrections channel is currently inactive. Read our corrections policy.