Ranpak’s third-quarter 2026 revenue growth is a poor shortcut for forecasting the next order of protective paper. Its 29 October Form 10-Q reports revenue of USD 101.9 million, up 2.3% year on year. Within that result, automation equipment sales grew while the volume of paper consumables fell. A fulfilment operation buying both should keep those signals in separate decision files. [1]
Revenue growth includes equipment, price and accounting effects
The issuer attributes the revenue change to a 3.5% contribution from paper-consumable price or mix and 2.8% from automation equipment sales, offset by 2.5% from lower paper-consumable volumes, 1.1% from foreign exchange and 0.4% from an increased non-cash warrant provision. These are the company’s rounded contributions to the revenue bridge. They are not five comparable product-market growth rates. [1]
| Reported category | Q3 2026 revenue | Year-on-year change |
|---|---|---|
| Automation | USD 14.6 million | +22.7% |
| Wrapping | USD 9.2 million | +8.2% |
| Cushioning | USD 35.9 million | +0.3% |
| Void-fill | USD 42.2 million | -2.8% |
Source: the issuer’s Q3 Form 10-Q. Figures are reported revenue and reported changes against Q3 2025, including the stated warrant provisions. Category revenue includes price and mix effects; it is not a physical-volume table.
Automation revenue increased from USD 11.9 million to USD 14.6 million. The filing reports 23.5% growth on a constant-currency basis, against the reported 22.7%. The constant-currency comparison removes foreign-exchange translation effects; it retains the stated warrant provisions. Neither measure establishes the productivity, payback or paper consumption of a customer’s installed line. The non-cash warrant adjustment belongs in the reporting reconciliation, rather than being treated as a paper price concession. [1]
Recurring paper demand needs its own regional comparison
In its geographic revenue bridges, the filing assigns a positive 1.8% contribution to paper-consumable volume in North America and a negative 4.9% contribution in Europe/Asia. These are components of two regional revenue reconciliations, rather than a common shipment index. They should not be averaged without the regional bases, and they do not establish a buyer’s actual paper consumption. [1]
For a buyer, a regional paper-volume decline can prompt a check of replenishment and inventory assumptions without proving that its own parcel activity fell. The relevant operating record is the number and mix of orders protected, the paper used for those orders and any inventory change between purchases and use. A supplier’s sales total cannot distinguish those customer-specific effects. It also cannot show whether a reduction in paper use reflects a changed product mix, a different pack design or fewer shipments.
A system count does not reveal utilization
Ranpak’s Protective Packaging Solutions installed base was approximately 142,800 systems at 30 September, against 145,600 a year earlier, a reported decline of 1.9%. That is a stock at a reporting date, covering cushioning, void-fill and wrapping systems. It is not a count of newly sold automation lines, nor a quarterly measure of operating hours or parcels packed. [1]
A smaller installed stock and higher automation revenue can therefore coexist without proving that the remaining protective-paper systems are working harder. Dividing quarterly revenue by the ending system count would combine different scopes and periods, while retaining price and product-mix effects. Buyers evaluating material demand should ask for the relevant installed system and its actual use; buyers evaluating a new automation project need acceptance evidence for that project.
Separate the consumables order from the automation case
The recurring order needs a specified protective construction, expected usage, replenishment terms and a clear price-review basis. The automation case needs a defined pack range and a trial showing whether the proposed equipment meets the buyer’s required output, changeovers and protection outcomes. Machine sales growth supplies neither acceptance record. Our protective-packaging engineering guide explains why the package and distribution route still govern protection qualification.
The next comparable regional volume and system-base disclosures can test whether Ranpak’s divergence persists. Customer utilization and commissioning records answer the separate question of what it means for a particular fulfilment operation. This is procurement interpretation of one issuer’s unaudited results, not an independent packaging-demand census, a customer performance study or an investment recommendation.
Sources / References
Ranpak Holdings. Form 10-Q for the quarter ended 30 September 2026, filed 29 October 2026. Relevant original text read: MD&A installed PPS systems, Q3 revenue by product, revenue bridge, geographic revenue reconciliations and constant-currency footnotes. Sources checked 31 October 2026. Unaudited company data; no independent customer-utilization or market-volume study.
Photograph credit
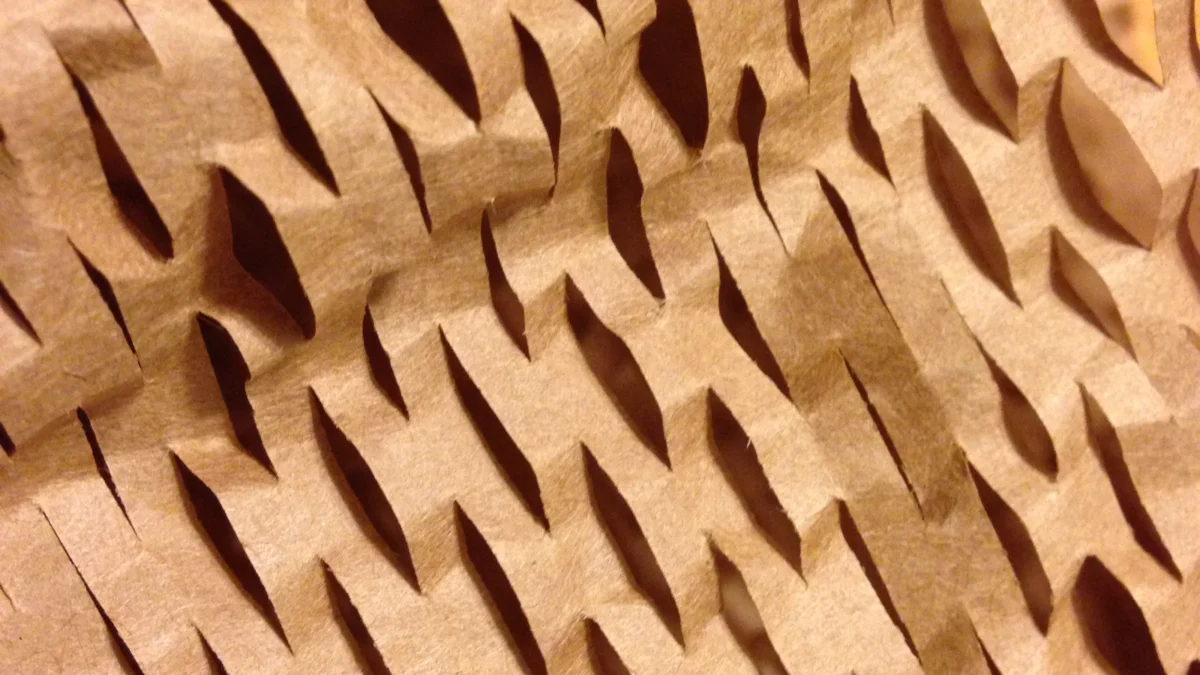
Expanded packing paper photographed on 9 January 2015 by Sally Wilson. Original photograph and provenance; CC BY-SA 2.0. Full composition retained, orientation corrected and resized to WebP; the image derivative retains the same licence. Archival material context, not an identified Ranpak product, a current customer installation or evidence of this quarter’s sales.
Found an error? Read our corrections policy and contact the editors.