
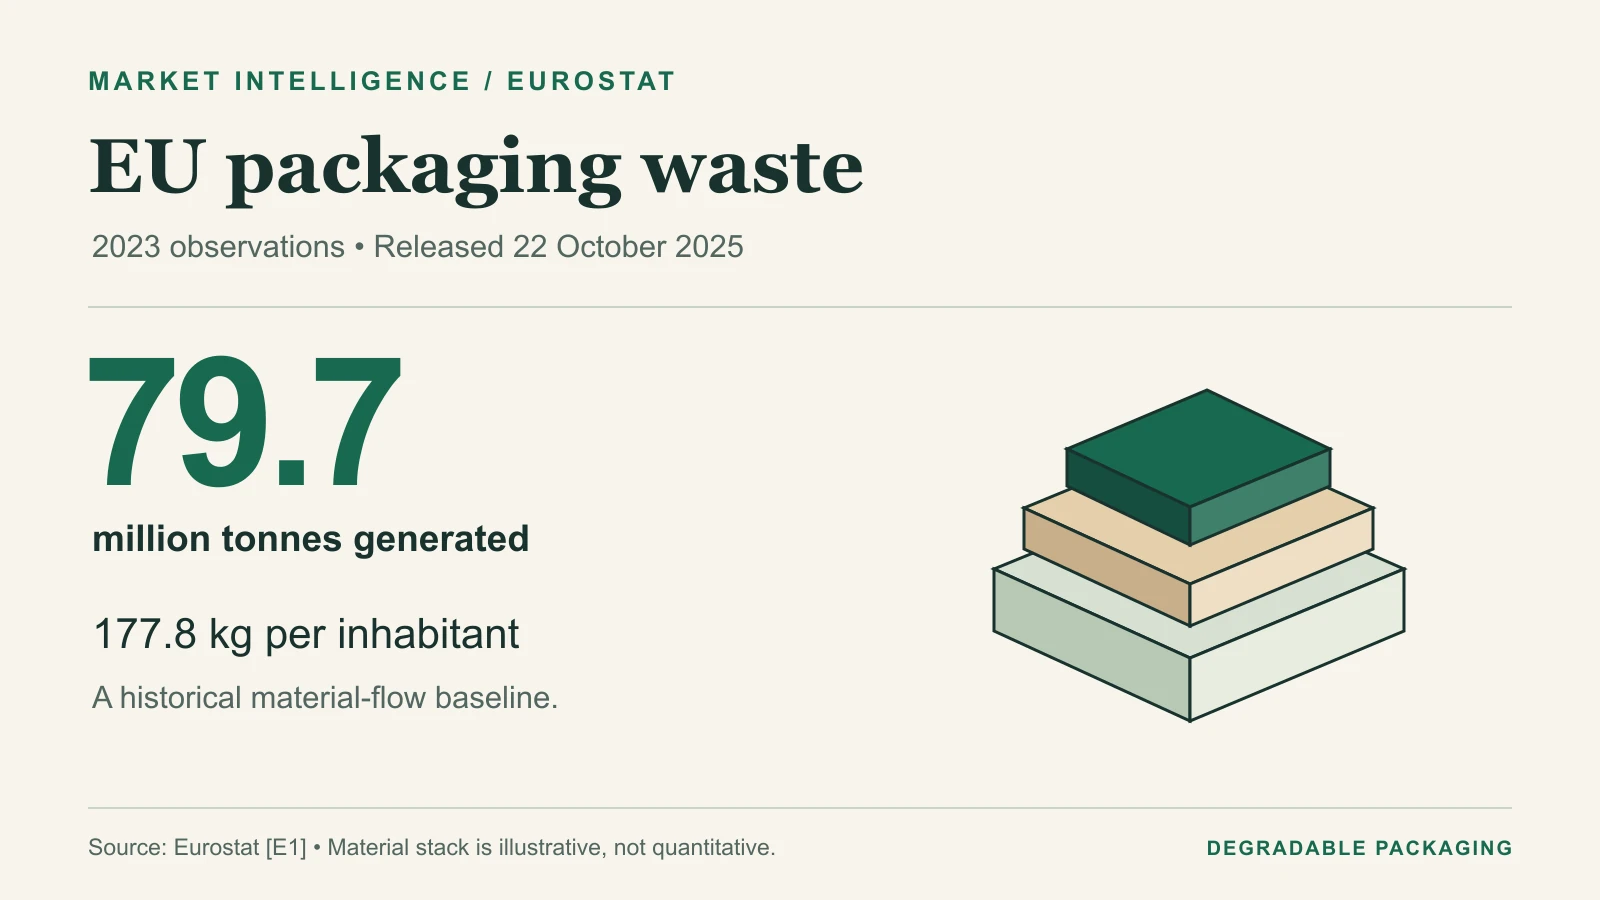
Eurostat’s release of 22 October 2025 describes packaging waste generated in 2023. Its value for industry readers is as a historical material-flow baseline. It is neither a new 2026 observation nor a forecast of packaging sales. [E1]
The editorial brief
A lower annual figure can sit above a longer-term baseline
Observation year2023
Release vintage22 October 2025; retain this vintage when reproducing the figures.
The headline numbers and their units
| Indicator | Published value | Scope / comparison | Reference |
|---|---|---|---|
| Total generation | 79.7 million tonnes | All packaging waste, EU, 2023 | [E1] |
| Per inhabitant | 177.8 kg | 2023 annual generation divided by population | [E1] [E3] |
| Change from 2022 | −8.7 kg per inhabitant | Annual comparison | [E1] |
| Change from 2013 | +21.2 kg per inhabitant | Decade comparison | [E1] |
The annual comparison and the decade comparison can both be true. Neither identifies a cause. Interpreting the change as weaker demand would require sales or production evidence matched to the same geography, period and material scope. It would also require an explanation of stocks, trade and the relationship between a package being placed on the market and becoming waste.
Material mix is a mass-based view
| Material | Share by weight | How to read it |
|---|---|---|
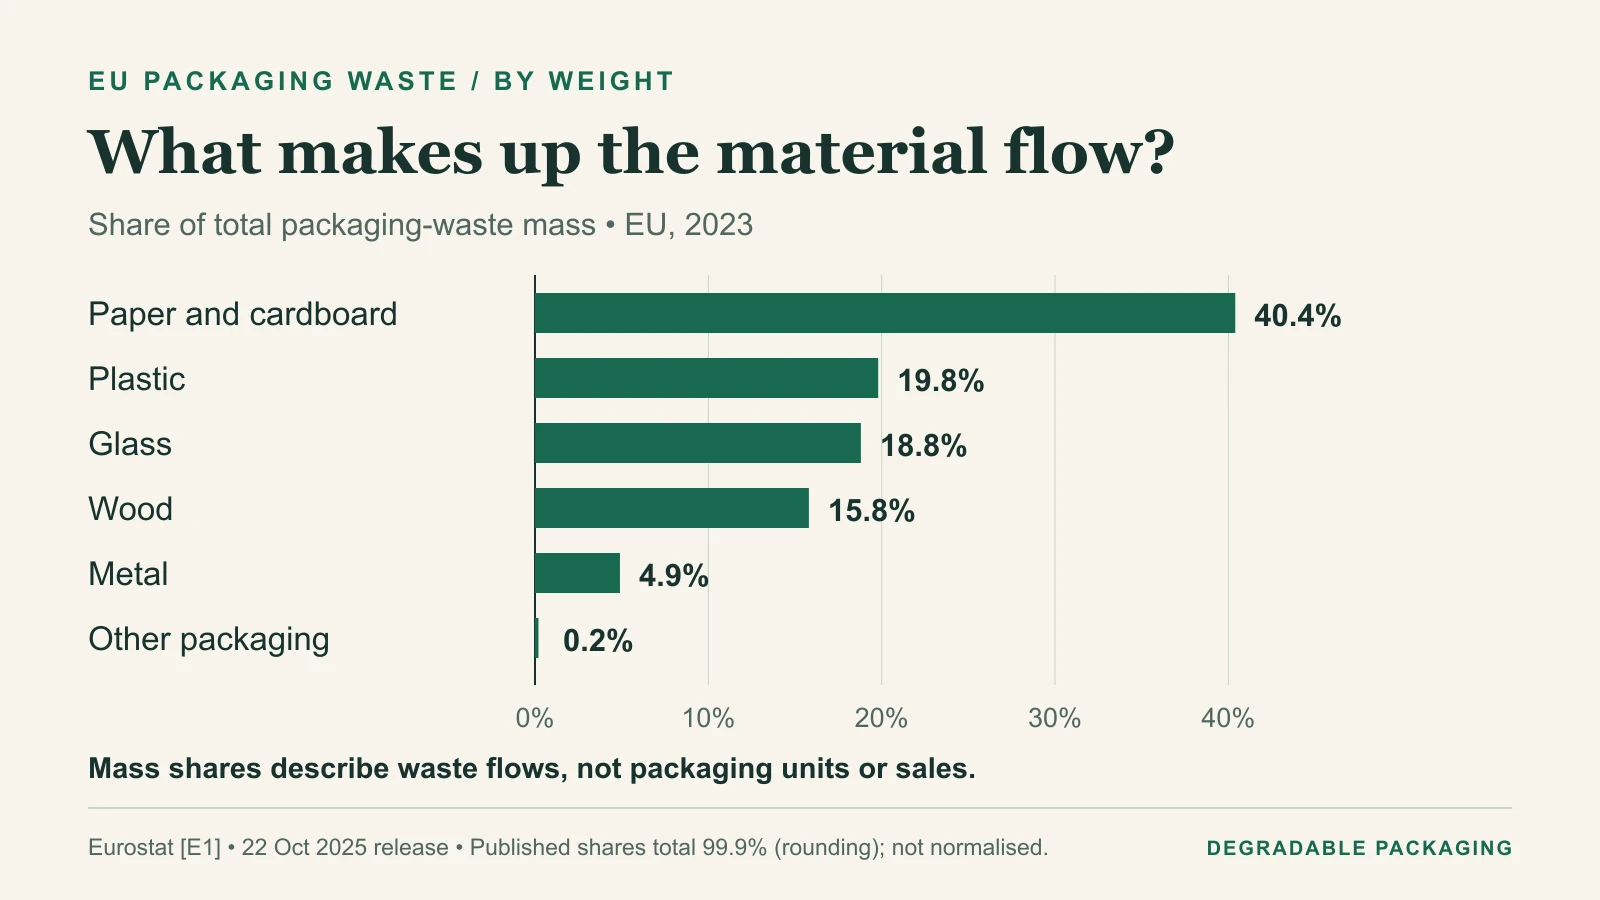
| Paper and cardboard | 40.4% | Share of total packaging waste mass. [E1] |
| Plastic | 19.8% | Not a share of packaging units or sales. [E1] |
| Glass | 18.8% | Mass basis; not a product performance comparison. [E1] |
| Wood | 15.8% | Same total-material denominator. [E1] |
| Metal | 4.9% | Same total-material denominator. [E1] |
| Other packaging | 0.2% | Published residual category. [E1] |
A heavier material can account for a substantial share of tonnes without representing the same share of packaging units. These figures therefore help describe waste-system material flows; they do not rank the efficiency, footprint or suitability of individual packaging formats.
Do not exchange recycling denominators
| Indicator | Published rate | Denominator / source |
|---|---|---|
| Overall packaging recycling | 67.5% | All generated packaging waste. [E2] |
| Plastic-packaging recycling | 42.1% | Generated plastic packaging waste. [E1] |
The rates are reported as published. They have not been recomputed from rounded kg-per-person figures. Eurostat defines the recycling rate using recycled waste divided by generated waste; reference-year 2020 introduced the recycling-process input calculation point. [E3]
A historical series needs its methodology attached
Check revision flags and calculation changes before joining observations from different releases. A changed accounting basis can affect comparability. Keep the material definition, observation year and source extraction date next to the figure, rather than only in a distant bibliography.
Use the baseline in a market-intelligence brief
- State the reference year and release date in the same brief.
- Use mass-flow evidence alongside independently sourced sales or production data when discussing demand.
- Do not turn a recycling rate for one material into an end-of-life claim for a named product.
- Retain a dated source extract when updating the analysis; distinguish a revision from a new observation year.
Methodology / editorial note
This article uses the 2025 news release and companion 2023 data explanation, not a new database extraction. The reference period is the calendar year; per-capita quantities use annual-average population. No causal model, forecast, product comparison or recalculation of the reported recycling rates was performed. Data may be revised, so the release vintage remains explicit.
Sources & reference notes
- [E1]Eurostat: 2023 packaging-waste news release. 22 October 2025. Total generation, per-person comparisons, material shares and the plastic recycling rate.
- [E2]Eurostat: Packaging waste statistics. Companion explanation; data extraction dated 10 October 2025. Overall packaging recycling rate and scope.
- [E3]Eurostat: env_waspac methodology. Metadata sections 3.4, 4 and 17–18. Definitions, measurement basis, calculation changes and revisions.
Update history
16 October 2026 — Added tables of baseline measures, material mix and recycling denominators; retained 2023 observations and the 2025 release vintage. The original publication date is retained. Added an original explanatory figure and updated the shared reading layout.
The public corrections channel is currently inactive. Read our corrections policy.